The combined impact of growing rooftop solar and the Covid-19 pandemic – along with the continued influx of large scale wind and solar – has create a suite of new records in Australia’s electricity grids in the September quarter, sending demand, emissions and prices to new lows.
The latest Quarterly Energy Dynamics for the September quarter, compiled by the Australian Energy Market Operator, also noted record highs for wind and solar output, which along with falling gas prices and cut-price bidding by coal generators trying to stay competitive led to the lowest wholesale prices in more than five years, and in some cases, record low prices,
Importantly, the emissions intensity of Australia’s main grid also fell to a record low of 0.7 tonnes of Co2 equivalent – thanks to the big reduction in black coal output and the increase in renewables, and despite a rise in the dirtiest fuel source, brown coal.
 AEMO says changes to consumer habits and industrial activity during the pandemic continue to reduce underlying demand, particularly in Victoria where the strictest limits on economic activity have been in place. But rooftop solar – now installed at record levels across the country – that had the greatest impact, lopping 218 megawatts off average demand, compared to Covid’s impact of 95MW.
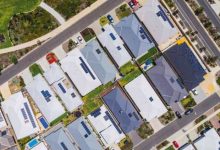
“The uptake of residential and commercial solar continues at record pace, which was largely responsible for new minimum operational demand records in Victoria, South Australia and Western Australia,” AEMO chief executive Audrey Zibelman said in a statement accompanying the report.
According to the QED, distributed solar PV met 71 per cent of South Australia’s total energy needs (underlying demand) on September 13, driving a new daytime minimum demand record of 379 MW. This was 79MW lower than the previous record set in 2019. A Victorian demand record low of 3,073MW was achieved on September 6, some 144MW lower than the previous record set in 2019.
It should be noted that both the South Australia and Victoria minimum demand records, and rooftop solar’s share of generation in South Australia, have already been broken on several occasions in October. Indeed, the combined output of rooftop PV and large scale solar meant South Australia’s state demand was entirely “solar fuelled” for one half hour period on Sunday, October 11.
Western Australia also set new minimum demand records, again thanks to rooftop solar PV, and its “balancing” price fell to the price floor of minus $1,000/MWh on six occasions in the September quarter. It had only ever hit the market floor on three occasions previously.
 It all points to ongoing radical change in the electricity market, with declines in legacy fossil fuel production and a growing shift to distributed energy. Of the legacy assets, only brown coal lifted its average output, but that was only because in the same period last year so many big units were out of action for major repairs.
Black coal output fell by an average of more than 400MW – to its lowest levels since 2014 – while gas output fell by an average of 436MW, because it was no longer required to replace the broken brown coal generators, and was now being displaced by cheaper wind and solar.
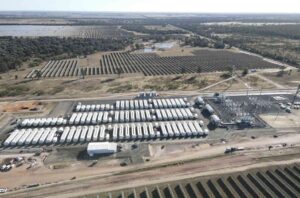
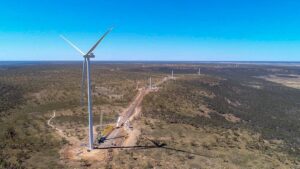
According to AEMO, the share of large scale wind an solar accounted for 14% of the generation mix, up from 12% in the same period a year ago, and reached a record peak of 35 per cent of total generation in September 27. (These figures do not include rooftop solar).
This, along with falling gas prices, and efforts by coal generators to lower their bids to ensure they were not forced to switch off, had an impact on wholesale prices, which fell by between 45-48 per cent across the National Electricity Market, compared to the same quarter last year, and to the lowest third-quarter level since 2014.
South Australian prices fell to their lowest level since 2011 for the September quarter, and their lowest on record for the month of September, as its share of wind and solar grew beyond 50 per cent.
Queensland, where large scale solar now sets the price at midday more than 30 per cent of the time, remained the lowest-priced region, with the average $32/MWh being its its lowest Q3 level since 2014, and the lowest of any NEM mainland region since Q2, 2015. NSW also had its lowest Q3 prices since 2014.
There were some other interesting records. Prices went negative on a record number of occasions in South Australia and Queensland, and in the month of September, the large scale solar farms in South Australia earned an average price of minus $9.70 a megawatt. That meant that they had to pay to produce power.
But despite the growing amounts of wind and solar, the number and cost of market interventions fell sharply, and the overall cost of “power system management” – including frequency control and the costs of grid curtailment – fell by more than one third.


