Despite featuring a week-long wind drought described as the worst, yet, for Australia, April 2024 still wound up outperforming the same month last year, with all large-scale solar and wind assets generating 3,410 GWh, up from 3,216 GWh (+6%) in April 2023.
According to the latest data Rystad Energy senior renewables analyst, David Dixon, it looks like solar may have come to the rescue as wind took a breather, with the best performing assets for the month “scattered across the country.”
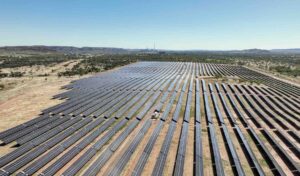
As the table below shows, the top of the charts for utility PV assets for April is X-Elio’s Blue Grass solar farm in Queensland’s Western Downs region, with a capacity factor of 29.5 per cent.
Making up the top three are RWE’s Limondale 2 solar farm in New South Wales (28.3% CF) and Sojitz Corporation/Eneos Edenvale solar farm in Queensland (27.8% CF).
Both Queensland and New South Wales are well represented in the top 20 charts for best performing solar farms, with eight projects each making the rankings. A a state level NSW was in top spot generating 947GWh with 422GWh from utility PV and 525 GWh from wind.
Notably, Victoria has only one asset in the top 20 of both the wind and solar best performers.
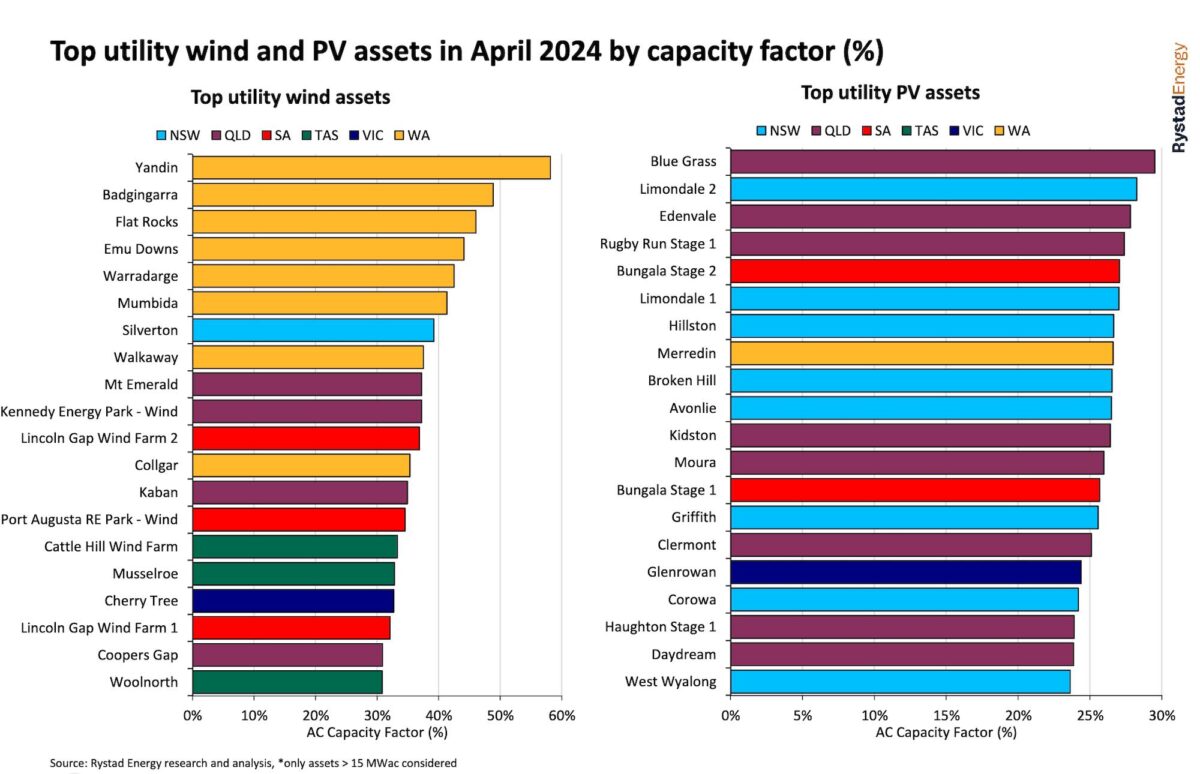
On the wind side of the equation, Western Australia escaped the wind drought and once again dominates the best performing projects, occupying seven out of the 10 ten spots in the charts for April 2024.
The top-performers for the month include the Ratch-Australia/Alinta Energy Yandin wind farm, with a capacity factor of 58 per cent, followed by APA Group’s Badgingarra (53% CF) and Enel Group’s Flat rocks (46% CF).
As RenewEconomy reported earlier this month, April 2024 featured the worst for wind energy “by a long way,” according to David Osmond, an engineer who works at renewable and storage developer Windlab – delivering just 42 per cent of the annual average for wind output.
“April tends to be the worst month of the year for NEM wind, typically (it is) 80 per cent of the annual average,” Osmond wrote on Twitter/X.
“The previous worst was 64 per cent,” he said on a X/Twitter thread. “Solar was very close to average, sunny weather making up for shorter days. Wind+Solar was 67 pct of annual average, also a record low, (previous worst was 70 pct).”