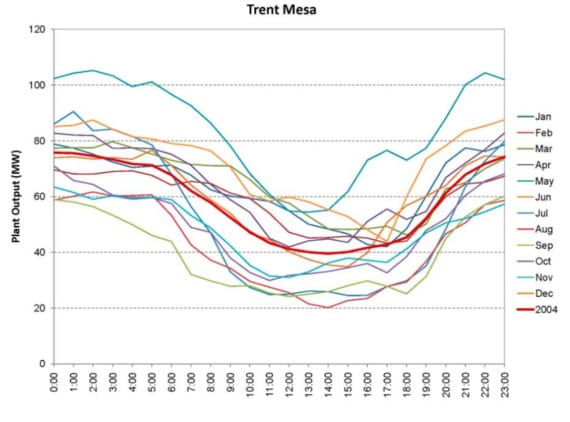
EVs charge mostly at night. As EV battery prices drop and become a mass-market item, they offer the opportunity to soak up nighttime peaks, allowing larger capacity of night-peaking renewables (wind power) to be deployed. Figures 1 and 2 show how the wind tends to peak at night. This will allow more to be available available during the day when demand peaks. Texas and California offer great examples of this with wind picking up as the sun goes down.

Consider Texas, the most wind-rich state in the country. It is building out wind rapidly. However, perhaps not as much as it would like. The problem is that wind in Texas is night peaking but the load from air conditioning peaks in the daytime. Wind is not a good match to the Texas load, as it stands. But if EVs were ubiquitous, they could charge at night, enabling Texas to better take advantage of its wind resources while reducing carbon emissions from autos and from the coal and natural gas power plants that would otherwise be required to charge them.
The graphs below are typical of summer load and generation profiles in Texas, and illustrate the point well.

While the graphs above show the resource for a day, figure 3 shows the typical behavior for the entire year.

The subscription-based educational portal Solar Learning Lab provides access to a variety of solar data sites from around the country. The screenshot in figure 4 below shows data from an Archer City Texas solar array. The match with wind, above, is quite good. If Texas pursues solar to augment wind, it will have an excellent complementary resource.

It is important to note that the fit is not perfect. Around 7:00 pm, solar has dropped off considerably while wind has not yet ramped. This can be addressed by use of tracking arrays. In the Southwest, they tend to be cost effective on an energy basis and in this case would have the added benefit of making the solar/wind pairing eligible for a much higher capacity credit. In other words, the tracking arrays would reduce or possibly eliminate the reliance on peakers by filling the ½ hour gap that otherwise is present during the transition from solar to wind.
Figure 5 below shows the benefit of tracking arrays. The data is from two solar arrays are at Rensselaer Polytechnic Institute in Troy NY. They are the same size and use the same inverters. One is on a fixed mount and the other on a tracking mount. Notice that the tracking array provides electricity until much later in the day.

Another way to address the notch is through load shifting. EVs are one way to accomplish load shifting but there are others with substantial potential. An excellent approach is to use a system like the Ice Bear. It stores cooling energy in the form of ice rather than a battery and can be a very cost-effective load shifter. Another example is to run your dishwasher later at night. This offers a double payoff by reducing electricity at peak hours while reducing air conditioning load by reducing the amount of heat at peak times (the dishwasher gives off heat when running).
California, with its large loads in LA and the San Francisco Bay Area, offers a useful case study. While it is true that the wind resource in late fall and winter is low in California, so too is its load. In the summer, when the demand is highest, wind power is very reliable and available through the night. In fact, if you look at the data, it turns out that wind power is very predictable in California, and thus a high-value resource.
The term intermittent can mean many things. The general understanding is that intermittent means unpredictable or random. Unfortunately, the term is often applied to renewables even when they are predictable, such as wind in Texas or solar in the Southwest. In those cases, suggesting that the resource is random is näive at best. See the following graph of solar production from a California-based solar array. Even on a rainy day, the array produces considerable energy. Of course, on a rainy day, temps and therefore AC demand would be lower. Generally, clouds and rain are predictable in California. The combination of advanced notice and load reduction minimize and possibly eliminate the grid stability ramifications that may be existent for high penetration of solar in other areas.


Some surface the concern that people will not respond to TOU rates. However, pilot programs are showing that people do respond and shift their usage. Figure 7 shows one such study. There are even scenarios emerging where coupling an EV with a solar array can LOWER the user’s electric bill. In other words, it is possible with some rate structures to add an EV and lower your electric bill! EVs are poised to play an important dual role of both reducing carbon from transportation and enabling higher penetration of renewable energy. The pieces are falling into place for a disruptive change in electricity use and distribution to a carbon-free paradigm.
Source: CleanTechnica. Reproduced with permission.
Clayton Handleman blog on renewable energy, Super Grid and low carbon transportation. Check out his blog here.


