ITP Analytics plan to publish quarterly reports analysing potential transition pathways of the Australian National Electricity Market (NEM). Our intent is to inform policy-making and public discussion.
Today we are publishing the first of the series – available here. We present it in the spirit of openness and dialogue. Clarifications and corrections will be made to the document in response to feedback.
Each quarterly report will have two parts. The first part will describe how the NEM may transition to an increasingly renewable energy future using scenarios based on the published climate and energy policies of the federal government and opposition parties. These scenarios will be revised each quarter with updated input assumptions.
The second part of the report will be a more in-depth study of a specific topic of interest. In this first report we examine the potential for hydrogen-fuelled open cycle gas turbines to support solar and wind capacity and reduce total electricity system costs.
ITP uses our openCEM model for the analysis. openCEM is a freely available open-source electricity grid modelling tool. It is designed to be used by decision makers, energy system planners, regulators, project developers and investors to determine how policy objectives (such as electrification, renewable energy, or emission reductions targets) can be achieved at least-cost, while maintaining energy security. For a given policy objective it reveals, for example:
- when, where, what type and how much generation, storage and transmission capacity should be added;
- how new generation and storage need to be operated in coordination with existing generation capacity to satisfy demand at the least cost.
Model outputs include all capacity and dispatch decisions for the system under consideration, as well a breakdown of capital and operating costs, utilisation, capacity, energy, and transmission statistics. In future reports this and more detailed and granular information, including retail price forecasts will be available via subscription.
Result highlights
In this brief overview we highlight key results of particular interest.
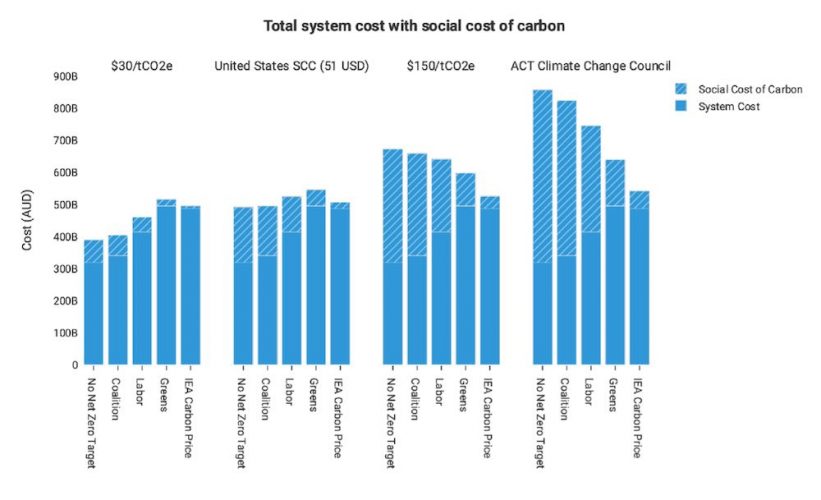
To explore the wider economic costs of each policy scenario we summed electricity system financial costs and the total carbon dioxide equivalent emissions of each scenario in tonnes multiplied by the four different proposals for a Social Cost of Carbon (SSC).
A SCC assigns a dollar value to the damage caused to the environment and society from each additional ton of carbon dioxide equivalent emissions (tCO2e).
Various methods for estimating a social cost of carbon have been published. These methods assess the cost of climate change on various parts of the economy, including labour productivity and agriculture, human health, and impacts on natural ecosystems that are typically unpriced.
For comparison purposes we used four different proposals for an SCC. Three are constant values, and we include a trajectory proposed for the Australian Capital Territory government by the ACT Climate Change Council in 202 (based partly on analysis by the US EPA).
The United States value is an interim value adopted by the Biden administration in 2021. $30/tCO2e is considered an unrealistically low value, but we include it here to show how quickly higher emitting scenarios can look less favourable as the SCC rises.
The results are illustrated below. It is apparent that striking the optimal balance between financial system costs and emission costs depends on assumptions about the SCC.
We contend that while the cost of damage caused by greenhouse gas emissions is difficult to definitively assess, it is worthy of much greater focus and public discussion.
It should be noted that this analysis sums electricity system costs and climate damage costs only. Broader economic impacts are not assessed by openCEM. These wider effects may be beneficial, such as the value of increased investment and employment, or negative such as the impact of higher electricity prices on energy intensive industry.
In part two of our report we analyse several scenarios in openCEM, with and without the ability to build green hydrogen gas turbines.
We based our hydrogen price pathway for 2022–2050 on forecasts from the Chief Scientist’s Briefing Paper on Hydrogen for Australia’s future. These prices assume Polymer Electrolyte Membrane (PEM) electrolysis as the method for producing hydrogen, which produces “green” hydrogen with zero emissions:
The Chief Scientist’s briefing paper states that hydrogen electrolysis will require dedicated wind and solar generators, so we have not assumed that the NEM provides this energy.
Whether grid connected or stand-alone, for every GWh of output from hydrogen gas generation, about three additional GWh of wind or solar derived electricity would be required to produce the hydrogen fuel.
The cost of this is largely embedded in the prices above. Funding to build the dedicated renewable generators used for electrolysis would likely come from private investment supported by government grants, which both the Coalition and Labor have announced.
 We found that even with hydrogen prices remaining conservatively high, there is an economic justification for converting existing natural gas turbines to hydrogen and building new turbines in the future fuelled only by hydrogen.
The transition from natural gas to hydrogen is made by openCEM when emissions reach near-zero, and the hydrogen turbines provide dispatchable capacity while lowering the total system cost.
We found that hydrogen turbines reduce the amount of pumped hydro that openCEM builds, as hydrogen gas generators are a competitive alternative by 2040. It mostly displaces a large amount of wind and solar relative to the additional capacity of hydrogen turbines that is installed.
For example, in the Labor scenario in 2050, 7.5GW of hydrogen gas turbines displaces over 20GW of solar, pumped hydro, and wind.
In the graph below, bars above zero indicate more capacity that was built in the hydrogen case than the base case, and bars below zero indicate less capacity being built in that year.
It illustrates that a small amount of hydrogen turbine capacity can displace a relatively large amount of pumped hydro, wind, and solar PV capacity.
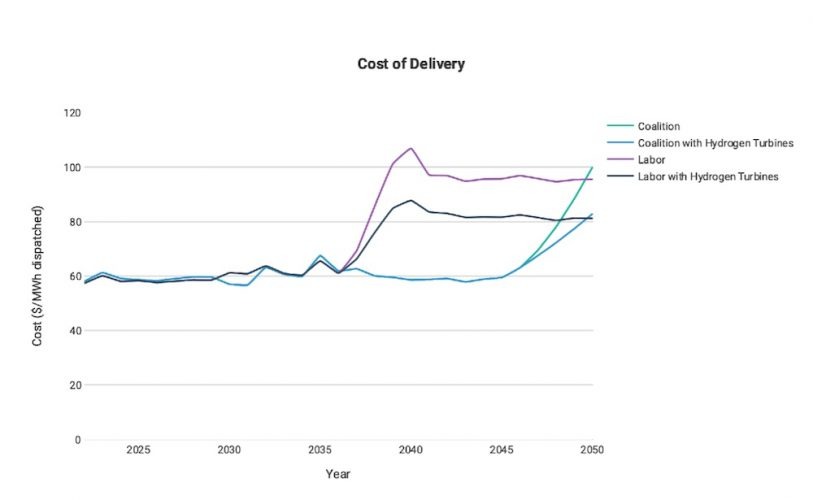
In the year that hydrogen gas turbines are built, the delivery cost in a scenario reduces compared to the same scenario without them. The delivery cost continues to reduce more in the years after a scenario reaches net-zero emissions, illustrating the effectiveness of hydrogen gas turbines as generators in a zero-emissions electricity market.
In the Coalition scenario, the delivery cost in 2050 is reduced by $20/MWh with the introduction of hydrogen gas turbines. In the Labor scenario, the delivery cost drops by almost $20 in 2050, and $15 in 2040.
The results summarised above, and many others, are discussed in more detail in the Quarterly Report.
Joel Davy, Jose Zapata and Oliver Woldring are from ITP Analytics

