Curtailment has become a defining feature of Australia’s National Electricity Market.
As more solar and wind enter the system, along with the ever growing behind-the-meter rooftop PV particularly, large amounts of utility generation are being switched off because there is nowhere for it to go. Transmission limits, insufficient storage, and inflexible demand all contribute.
On some days, tens of thousands of megawatt-hours of renewable electricity are curtailed. These are not marginal quantities. They represent enough energy to run industries, fleets, or communities intermittently — if only the outlets existed.
This post explores curtailment as a kind of pop-up energy store: an unexpected surplus with no permanent channel.
It considers the tensions in how curtailment is perceived, introduces the Dolphin Curve as a reframing, and then draws on Kevin Kelly’s thinking about hill-climbing and hill-making to suggest why the spaces in between matter.
From there, it layers in analogies of real estate and stock, lessons from pop-up culture, and thoughts on adaptation and the future.
Curtailment as Surplus
Excess can be valuable, but only if a channel exists to use it.
In retail, when too many goods arrive — whether from seasonal peaks or overstock — pop-up shops often appear. They exist because the normal channels cannot absorb the excess, and the supply must find another way to reach customers.
Curtailment is not so different. Bursts of free, weather-driven energy arrive in the middle of the day, yet the system has no equivalent storefront. Without a place to flow, the surplus is curtailed, and the opportunity is lost.
This makes curtailment not just a technical problem, but also a social and economic one — a tension that looks different depending on where you stand.
Multiple Views, Shared Tension
The same event can be seen as loss, waste, progress, or inevitability.
Curtailment is not experienced in a single way:
- For project owners: It is loss of income and greater risk, sometimes prompting costly investment in batteries that bring risks of their own.
- For system planners: It is a step forward, proof that renewable capacity is growing fast enough to exceed demand at times.
- For observers: It looks like waste, a contradiction in an energy system still struggling to decarbonise.
- For others across domains: It prompts questions about why the surplus is not channelled into obvious uses — water, transport, heat, or new industries.
These perspectives highlight that curtailment is not only about electrons and wires. It is also about meaning, framing, and perception. This is why naming and analogy matter.
The Dolphin Curve
The shape of a problem often defines how we perceive it.
The demand side of the system already has a well-known image: the Duck Curve, describing the midday dip in net demand as rooftop PV surges. Curtailment has its own distinct daily profile. Some have called it the Shark Curve, pointing to its sharp peak and steep decline — see above.
Yet “shark” suggests menace and danger. Curtailment, though disruptive, is also a sign of playful abundance — energy surfacing in excess, then dipping back beneath. A more fitting metaphor is the Dolphin Curve.
- It reframes perception: Rather than fear, it suggests opportunity.
- It signals abundance: Curtailment arises only when renewables are plentiful.
- It highlights temporality: Like a dolphin surfacing, curtailment is visible, fleeting, and recurring.
The Dolphin Curve helps us to look again at curtailment not as waste, but as a sign of a system in transition. From here, we can build out further analogies that help us see what might be done.
Hokusai’s Great Wave off Kanagawa
Curtailment as Real Estate
An empty shopfront is a wasted opportunity until a tenant arrives.
One way to understand curtailment is as unused grid real estate. When the wires are congested, renewable energy is turned away — the equivalent of shopfronts left idle.
- Empty shopfronts = curtailed energy.
- Pop-up tenants = flexible loads.
- Property managers = storage.
This analogy highlights curtailment as a platform problem: keeping the “grid space” from sitting empty when it could be filled with activity. If real estate helps us see the platform, then stock helps us see the product.
Curtailment as Stock
Abundance can spoil if it is not moved quickly.
Energy is also like perishable stock. If it is not used or stored, it goes to waste.
- Unsold produce = curtailed energy.
- Bargain hunters = flexible demand, opportunistically taking it.
- Logistics = storage and shifting across time.
This analogy reframes curtailment as a product problem: finding the right channels to distribute surplus before it perishes. Together, the real estate and stock analogies show curtailment as both platform and product — both space and supply.
Lessons from Pop-Up Culture: Design and Practice
Impermanence can be a feature, not a flaw.
Pop-ups succeed because they are designed for flexibility. They avoid the overheads of permanent stores and rely on modular, low-friction infrastructure that can be set up and dismantled quickly.
Applied to energy, this suggests that flexible loads need the same principles:
- Low overhead: Opportunistic demand must be cheap and easy to connect, such as containerised electrolysers or modular EV chargers.
- Fast setup: Technologies must be able to “move in” quickly when surplus arises, and exit without cost when it disappears.
- Experimentation: Just as retailers use pop-ups to test markets, curtailed energy zones could become trial sites for industrial loads, desalination, or new storage forms.
The lesson is that temporary abundance is best met with temporary solutions. To make sense of these, Kevin Kelly’s frames of hill-climbing and hill-making can guide us further.
Bringing in Kevin Kelly
New forms often emerge where categories blur.
Futurist Kevin Kelly distinguishes between hill-climbing — optimising within familiar systems — and hill-making — creating entirely new terrains. Both matter, but it is in the spaces between where new ideas often take root.
So far, our responses to curtailment have been hill-climbing: transmission upgrades, more storage, better forecasting. Important, but confined to existing slopes.
The Dolphin Curve hints at the need for hill-making: treating curtailment as raw material for new uses, markets, and behaviours that emerge in the in-between.
The Spaces Between
Innovation often happens in the gaps no one owns.
Curtailment sits in an in-between zone: not generation, not demand, not infrastructure, but something produced by their interaction. This makes it fertile ground for experimentation.
Some possibilities lie here:
- Flexible industry: Electrolysers, data centres, or mineral processing that switch on when surplus is available.
- Community absorption: Neighbourhood batteries or smart appliances that nudge demand upward when the system is spilling.
- Pop-up markets: Temporary contracts that reward demand that appears only during curtailment.
- Transport links: EV fleets or rail systems aligned with daytime abundance.
- Water-energy links: Desalination or pumping when surplus exists.
- Agriculture and cooling: Irrigation, cold storage, or controlled farming that flexibly respond to surplus.
These are not yet radical hill-making shifts. They are bridges — practical steps in the spaces between — that let us begin treating curtailment as a resource rather than waste.
Inefficient Exploration
Discovery requires tolerance for paths that lead nowhere.
Hill-making is messy. Some experiments will fail. Others will look impractical at first. But without them, the system risks remaining trapped in incremental fixes.
Exploration might involve:
- Regulatory sandboxes: Safe spaces for testing new demand models.
- Innovation zones: Pilots in areas of frequent curtailment.
- Flexibility contracts: Instruments rewarding temporary participation.
This is where the Dolphin Curve connects back to practice: an acceptance that abundance needs trial, error, and adaptation. To appreciate the scale of the opportunity, it helps to look directly at the data.
Curtailment Records in the NEM
Patterns of waste can also be patterns of opportunity.
The daily curtailment data and graph below shows both the scale and variability of surplus energy.

Daily NEM Curtailment – Peak Days | GPE NEMLog
At the other extreme, some days see almost no curtailment — as little as 5–12 MWh. This highlights how weather, demand, and infrastructure align in complex and sometimes unpredictable ways.
Across the dataset of the last 3 years, the average curtailed energy was ~11,757 MWh/day, with a median of ~7,039 MWh/day. The top 10% of days exceeded ~29,200 MWh, enough to power major industries if it could be captured.
These figures make clear that curtailment is not an occasional glitch but a recurring feature of the system. This leads us naturally to how adaptation and expectations can reframe it.
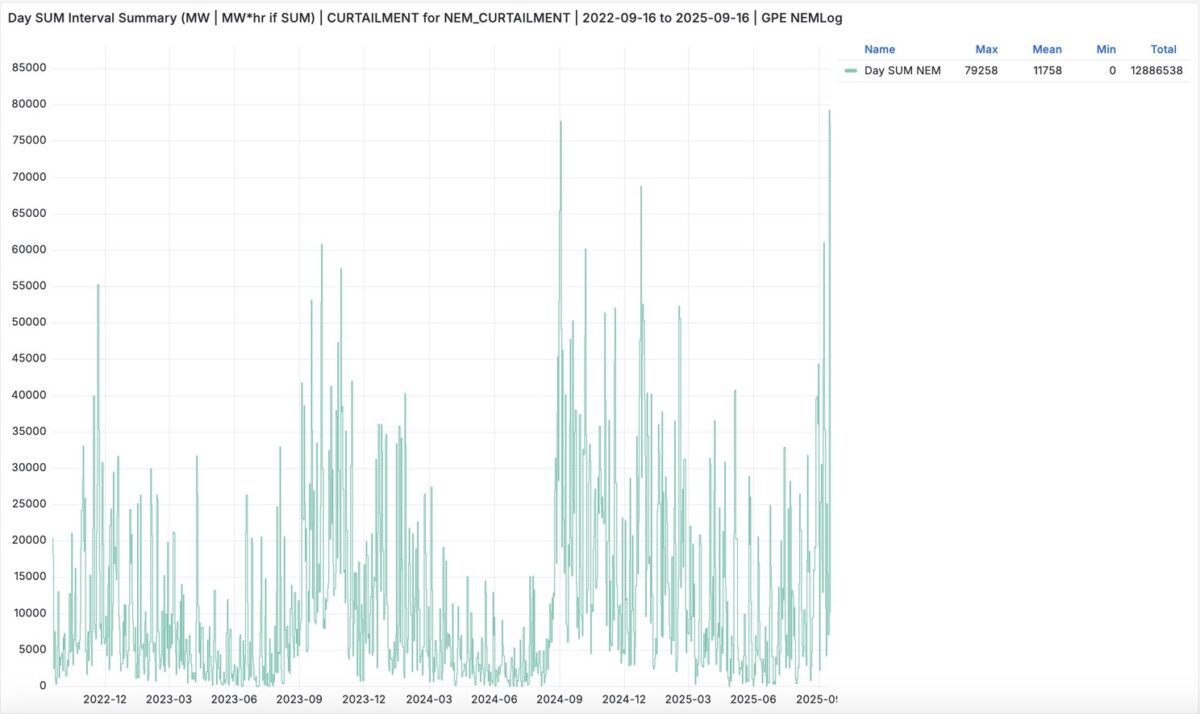
Daily NEM Curtailment Energy (MWh) for period 16 Sep 2022 to 16 Sep 2025 | 12,885 GW Spilled | GPE NEMLog
Adaptation and Expectations
Impermanence can be designed for, not resisted.
Pop-up culture shows us that customers expect impermanence and adapt to it. Empty shelves are not failure but part of rhythm. Retailers design modular systems, and communities treat pop-ups as opportunities.
The same could be true for curtailment:
- Scarcity as attraction: Limited-time offers create urgency. Curtailment could become “energy happy hours”.
- Community experience: Surplus could be channelled into local batteries, neighbourhood discounts, or demand festivals.
- Seasonality as rhythm: Curtailment could be accepted as seasonal abundance, not anomaly.
- Signalling maturity: Just as retail surplus shows a deep ecosystem, curtailment signals a mature renewable grid.
This cultural shift opens the door to thinking about what comes next.
Looking Ahead
Abundance deserves its own institutions.
Curtailment will grow as renewables expand. But how we frame it will shape what happens next.
- Policy signals: Reward demand shifting into surplus periods.
- Business models: Create curtailment clubs or industrial contracts tied to abundance.
- Technology platforms: Automate opportunistic consumption.
- Cultural reframing: Treat curtailment as an expected, even desirable, feature of abundance.
Looking ahead, the Dolphin Curve is not a threat but an invitation: to fill the spaces between, to climb existing hills more efficiently, and to begin making new ones.
Conclusion
Curtailment today is measured as megawatt-hours lost. But if we treat it as both real estate and stock, draw lessons from pop-up culture, and apply Kevin Kelly’s insights into hill-climbing, hill-making, and the spaces between, it becomes something else.
The Dolphin Curve is not just a profile of waste. It is the shape of abundance, fleeting and recurring, playful and disruptive. It reminds us that what looks like loss may also be the raw material for invention.
Between what is wasted and what is used lies the chance to imagine differently.
Geoff Eldridge works at GPE NEMLog, providing energy transition insights from Australia’s NEM.