I have recently presented research findings from my modelling of WA’s South West Interconnected System (SWIS) at the World Renewable Energy Congress at Murdoch University. This is the latest analysis using my high level system dynamics model of the SWIS, the first of which featured in RenewEconomy way back in 2014.
In that report I set out the results of modelling the take-up of private behind-the-meter (BTM) solar PV based on savings to customers arising from reducing costs of PV.
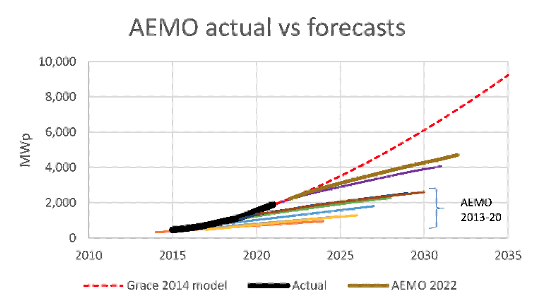
Each year, AEMO produces a projection of private solar as a component of their Statement of Opportunities (SOO) report. I have been tracking that since 2014, noting that each year they have had to re-appraise based on actual take-up.
As the figure below illustrates, they continually fail to accurately predict both the dynamics (i.e. exponential growth) and the end point (i.e. when the market is saturated and capacity levels off).
Why is this important? Planning for a transition to renewables requires projections of network demand. If you continue to underestimate the rise of private generation you think you have more time to accommodate the necessary changes than you actually do.
My recent modelling indicates that through a combination of residential and commercial take-up of BTM solar PV with precinct scale microgrids (such as this project in which I was involved), the capacity of private solar will continue to grow rapidly, potentially reaching 7,000 MW by 2030.
Private battery storage lags, but as capital costs decrease, the business case improves and capacity could reach 4,500 MWh by 2030.
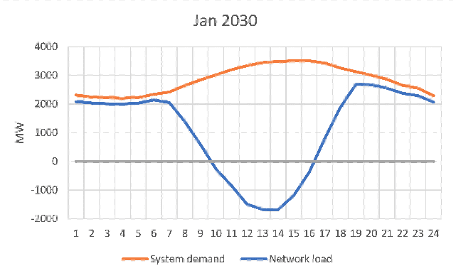
The impact of this on network demand is already being felt but within a few years will lead not just to low loads but to negative loads, as has already occurred in South Australia.
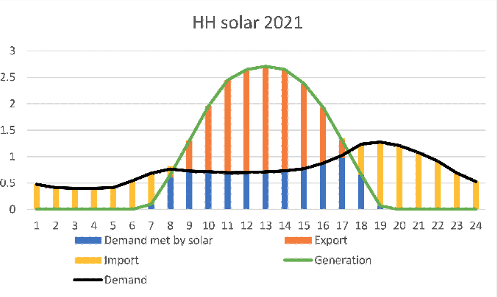
In SA, however, that negative load just reduces the total load in the NEM. The islanded SWIS has nowhere to export power. To see why this will occur in WA is obvious from a depiction of a single private residential 4.7 kW system (the current average – new systems are much larger) on an average day.
Such a system can only meet about 50% of demand, the rest is exported to the SWIS, notably not helping meet peak demand. Although the cost-benefit of larger systems is marginal, the costs have become so low that solar suppliers are spruiking, and punters are buying, much larger systems.
This will continue as long as the unit cost of solar PV continues to fall, which most predict will be for some decades.
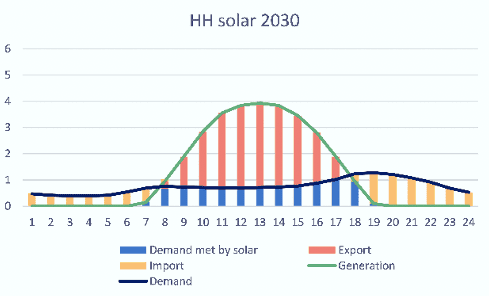
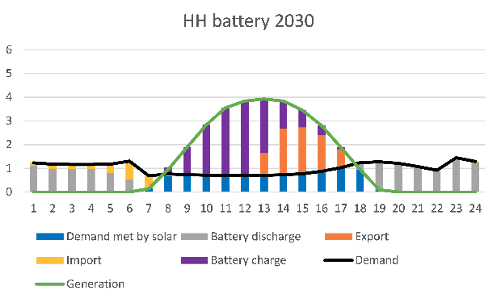
By 2030 an average residential 6.8kW system on an average day looks like this (below) for a house without a battery, and for a house with a 15 kWh battery and an EV which is trickle-charged overnight.
The exports from houses with larger systems and no battery will increase significantly. Imports and exports from houses with batteries will reduce significantly but not completely.
So, what does this all mean for the SWIS? By 2030 the model projects that a summer day could look something like this, with private premises and microgrids supplying all demand in the middle of the day, and exporting the excess to the SWIS.
The knee jerk reaction of network managers to this scenario is to curtail private generation to retain network stability.
This may be possible under recently introduced rules that require all new and upgraded inverters installed with a capacity of 5kVA or less to be capable of being remotely switched off “during an extreme minimum demand event” (which will become an every-day event in most months).
However, this would be a perverse outcome leading to the curtailment of (almost) free renewable energy to allow fossil fuel generators to continue operating.
The industry needs to get to face up to the fact that the rise of prosumers means that the network is just one component of an integrated energy system, and act accordingly.
Their job is not to protect the existing arrangements, it is to deliver the most efficient outcomes for the community. So, what could a future network look like?
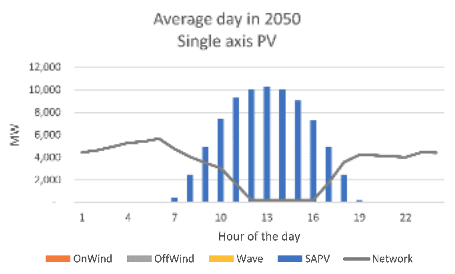
Given the diurnal shape of the future network load, baseload generation is untenable and large scale solar is not ideal, merely adding to excess generation during the middle of the day.
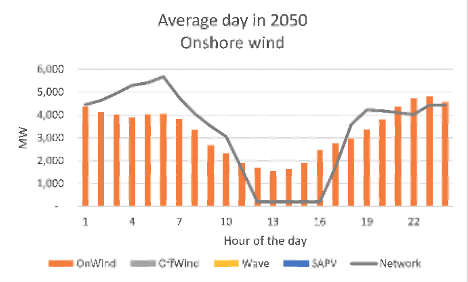
In WA, onshore wind in fact has the best diurnal profile, as generation is typically lower in the middle of the day. The graphs below match daily demand and generation.
Both solar and wind generation are lower in the winter, meaning onshore wind together with offshore wind and / or wave (which are more seasonally consistent), will likely be the optimal combination.
The amount of generation required to meet peak demands will be huge, and lead to very frequent curtailment without both storage and the retention of peaking plants (operating at similar capacity factor as presently). Even so, the exports from private systems and excess network generation will still be very significant.
A solution to this would be to twin hydrogen electrolysers with open cycle gas turbines (OCGTs). When network loads are low and heading negative, the operator would “call in” load from these (already network connected) facilities to run the electrolysers at zero energy cost.
Sufficient hydrogen would be stored on site to operate the peaking plants when dispatched at peak periods. Balancing excess generation with hydrogen production would minimise and potentially eliminate curtailment and transition OCGTs from gas to hydrogen over time, eliminating the last mile of emissions.
The hydrogen scenario, while attractive from a thermodynamic efficiency and network management perspective, is not likely to be economically viable until the capital cost of electrolysers reduces significantly.
The graph below illustrates the annual network generation / storage costs of each scenario in 2050 (in 2022$), which are not significantly different to present generation costs per MWh. Until then, curtailment of private and network generation will be necessary to manage the stability of the grid.
The other question arising from this analysis is about how the market is managed. Over recent decades we have constructed a complex trading arrangement between generators and retailers responding to real time demand.
This arguably makes some sense when costs are highly influenced by variable generation costs (mainly fuel).
However, renewable generators and energy storage are largely fixed cost facilities. They will have to be paid to exist irrespective of their utilisation, otherwise no one will invest in them in the first place.
This should give rise to a much simpler capacity based market in which the charges for energy reflect the lifecycle costs of the generation and storage facilities needed to efficiently meet demand with zero emissions.


