One of the world’s leading methane scientists has called out LNG for being a larger emitter of carbon dioxide (CO2) than coal – by a whopping 33 per cent over its life cycle.
The finding flies in the face of LNG advocates who have long claimed the fossil fuel is cleaner than coal, arguing that if the alternative is to burn more of the latter then the former deserves a place as a “greener” alternative.
Comparing life cycle emissions over a 20 year period led to a figure of 160 g CO2-equivalent/MJ for LNG versus 120 g CO2-equivalent/MJ for coal. The report’s author, Dr Robert Howarth from Cornell University, says that is because methane emissions from the extraction of fossil gas are higher than for coal.
“As a greenhouse gas, methane is more than 80 times more powerful than carbon dioxide when considered over a 20-year period,” he said in a paper published in the Energy Science & Engineering journal.
“Clearly, greenhouse gas emissions from LNG must be larger than from the natural gas from which it is made, because of the energy needed to liquefy the gas, transport the LNG, and regasify it. The liquefaction process alone is highly energy-intensive.”
Using GWP20 (Global Warming Potential over 20 years), accounted for the impact of methane which is more potent but breaks down much faster than carbon dioxide.
As a result, accounting for the destructive nature of the gas over the time it is actually in the atmosphere (as opposed to over 100 years, or GWP100, as many Australian reports use) bumps up the impact of emissions from LNG by about three times.
“Overall, the greenhouse gas footprint for LNG as a fuel source is 33% greater than that for coal when analyzed using GWP20,” Haworth wrote.
“Even considered on the time frame of 100 years after emission (GWP100), which severely understates the climatic damage of methane, the LNG footprint equals or exceeds that of coal.”
Getting the feedstock is the killer
Haworth’s research focused on exports of US shale gas, an industry that took off in the 2000s to the point where the country was swimming in so much gas the federal government lifted LNG export bans.
He measured methane and CO2 emissions created by gas extraction, storage and processing plants, and from the high-pressure pipelines that bring gas to LNG liquefaction facilities, liquefaction, transport and regasification, and burning by the end user.
Howarth found US domestically-produced gas used at home for electricity has a life cycle greenhouse gas footprint similar to coal.
But the footprint of LNG, which requires extra processing and extra transport, dwarfed these even when shipping distances were short.
“The greenhouse gas footprint for LNG is 28 per cent greater than that of coal for the shortest cruises and 46 per cent greater for the longest cruises,” the paper says.
Doing so revealed where the big leaks and emissions creations came in the supply chain.
Burning LNG for fuel accounts for a little over a third of the total carbon footprint.
Contrary to many studies in Australia, it was the production, storage and transport of gas to liquefaction plants that was the biggest contributor to LNG emissions, accounting for 46-48 per cent of the total.
The techniques required to get shale gas out of the ground – hydraulic fracturing or fracking – mean other gases and particularly methane also escape.
Liquefaction itself makes up just 8.6-9 per cent of the footprint, while transporting LNG is a little tricker, as it depends on the fuel used by the tanker and the way it’s burned, accounting for 2.4-4.4 per cent of the total.
The remainder comes from regasification and transport to, usually, electricity generators.
Australian LNG unlikely to be better
There is little accurate data on methane emissions from Australia’s gas industry, but non-industry monitoring as well as what is known about the CO2 content of domestic gas sources suggests it could be much, much higher than companies are reporting.
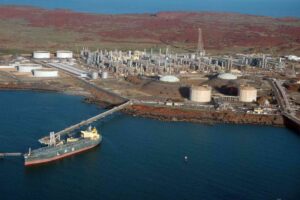
The Gorgon gas field in Western Australia has the highest average CO2 content at about 15 per cent of all global LNG sources looked at by a Nature study in 2020 into the greenhouse gas intensity of LNG exported to China.
“And thus the highest processing emissions,” the paper said.
And while shale gas exploration is in its infancy in Australia, the coal seam gas reserves in Queensland and New South Wales (NSW) require similar tech to get out of the ground as the shale gas in the US – fracking.
Last year, Clean Air Task Force infrared camera study found 101 leaks and methane venting at 15 of 38 sites visited in NSW, and at 20 of 42 sites visited in Queensland.
At some sites there were multiple emissions points from a single piece of equipment.
Venting, where gas is deliberately released, was found at four of seven Santos coal seam gas wells surveyed in the Pilliga/Bibblewindi forest in NSW, and at the APA-operated compressor station at the Wallumbilla Gas Hub.
In August, the federal government agreed to a series of reforms to change how methane emissions are measured by the coal and gas industry, after finding that current data is horribly inadequate.
Meanwhile, AAP reports that new monitoring platform Open Methane – which uses satellite-based measurements and ground-based verification to track emissions – estimates methane levels could be twice as high as what is currently reported.
Chair of climate think tank The Superpower Institute and former consumer watchdog head Rod Sims has officially launched the new Open Methane platform.
“Accurate data is the foundation of effective climate policy: if we can’t measure it, we can’t manage it,” he said.
Australia’s 20 highest emitting locations were all linked to coal or gas extraction, suggesting these sectors could be producing as much methane as the agriculture industry, if not more.