May 2015 was a significant month for wind generation. It was the first month in which total annualised generation from wind, meaning generation in SA, Victoria, NSW and Tasmania combined(as there is no significant wind generation in Queensland), was greater than annualised gas generation in those four states.
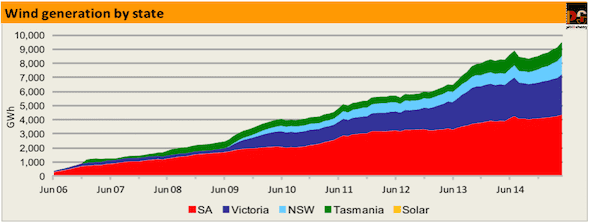
Total wind generation in the year to May reached a record level (Figure 10) of 9.6 TWh, which was 5.5 per cent of total sent out NEM generation. In the half hour after midnight on Sunday 10 May a new record average total output over a trading interval of just over 3.2GW was achieved (the highest 5 minute dispatch interval output was even larger).

For the month of May itself, total wind generation was 1,050 GWh, also the highest ever monthly total, just exceeding the 1,043 GWh in July 2014. The share of NEM generation for the month was 6.8 per cent. The overall weighted average capacity factor for Australia’s wind generators was 40% in May 2015, compared with the 44 per cent of July 2014, when several of the wind farms now on line were still under construction. As can be seen in Figure 10, July 2014 was an unusually windy month.
This is an extract from the CEDEX Carbon Emissions Index report for June 2015, by pitt&sherry. Reproduced with permission