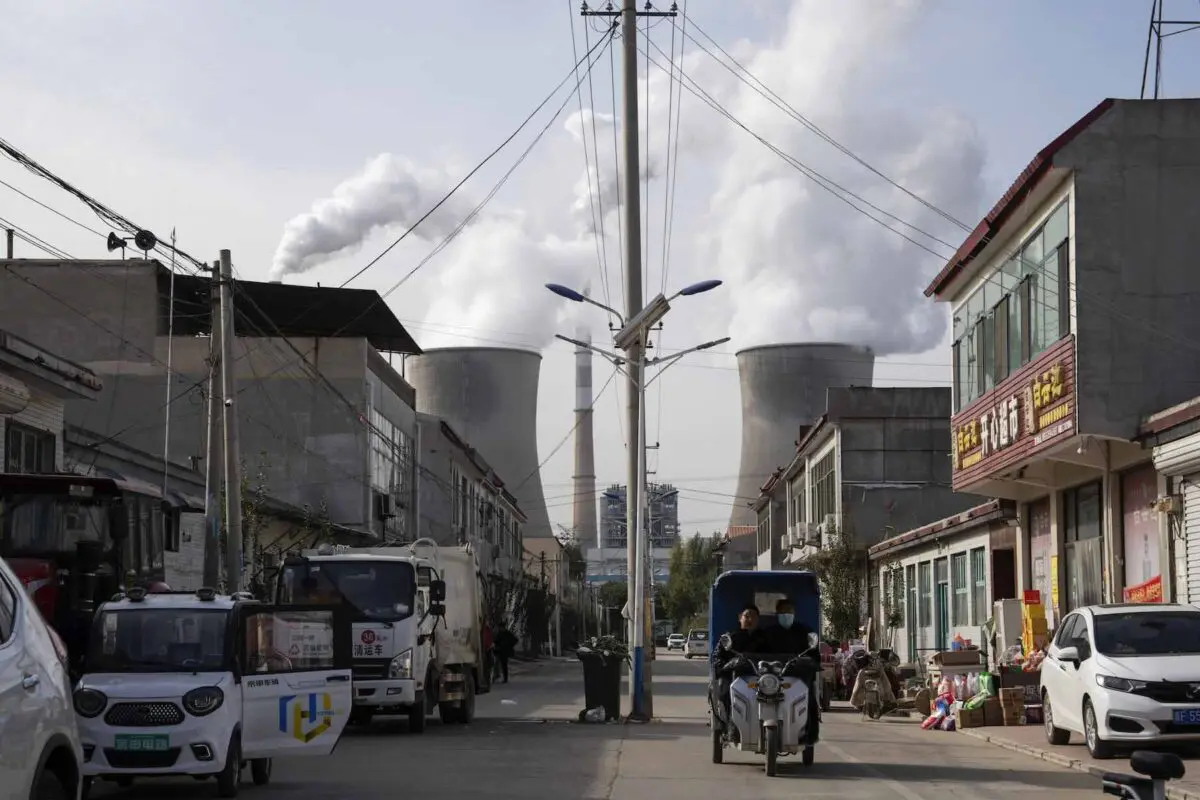
New analysis for Carbon Brief, based on official figures and other data that only became available last week, reveals the true scale of the drop in coal’s share of the mix.
Coal lost seven percentage points compared with May 2023, when it accounted for 60% of generation in China.
Other key insights revealed by the analysis include:
- – Monthly National Bureau of Statistics (NBS) data on generation by technology is now severely limited for wind and solar. For example, it excludes “distributed” rooftop solar and smaller centralised solar plants, capturing only about half of solar generation.
- – This mismatch becomes clear when comparing the NBS total for monthly electricity generation of 718 terawatt hours (TWh) with reported monthly electricity demand of 775TWh, according to the National Energy Administration (NEA). In reality, electricity generation must be higher than demand due to losses at power plants and on the grid
- – Media reports have speculated that the record renewable capacity additions would have run into grid constraints in May, but the new data shows this is not the case.
- – China’s electricity demand in May 2024 grew by 49TWh (7.2%) from a year earlier.
- – At the same time, generation from clean energy sources grew by a record 78TWh, including a record rise from solar of 41TWh (78%), a recovery from earlier drought-driven lows for hydro of 34TWh (39%) and a modest rise for wind of 4TWh (5%).
- – With clean energy expanding by more than the rise in electricity demand, fossil fuel output was forced into retreat, seeing the largest monthly drop since the Covid 19 pandemic. Gas generation fell by 4TWh (16%) and that from coal by 16TWh (4%).
- – Falling generation from fossil fuels point to a 3.6% drop in CO2 emissions from the power sector, which accounts for around two-fifths of China’s total greenhouse gas emissions and has been the dominant source of emissions growth in recent years.
The new findings show a continuation of recent trends, which helped send China’s carbon dioxide (CO2) emissions from fossil fuels and cement into reverse in March 2024.
If current rapid wind and solar deployment continues, then China’s CO2 output is likely to continue falling, making 2023 the peak year for the country’s emissions.
Monthly mismatch
Every month, the NBS publishes data on China’s electricity generation by technology. The figures for May 2024 came out nearly a month ago, in mid-June, and were widely reported.
However, this data is increasingly limited because it excludes, among other things, “distributed” solar sites, such as those on the roofs of homes and businesses. Analysis for this article shows this misses out about half of the electricity generated by solar overall.
The fact that the NBS data on power generation is incomplete is obvious when looking at consumption numbers: the NEA reported electricity consumption in May was 775TWh, while the NBS reported generation at only 718TWh. In reality, generation must be significantly larger than consumption because of losses at power plants and in transmission.
The seemingly small amount of power generation from solar and wind reported by the NBS has caused confusion and has led to claims that the performance of wind and solar in China is poor.
The performance of wind and solar generation is tracked by “utilisation” data collected by China Electricity Council (CEC), showing actual output relative to the maximum potential. These figures are normally included in monthly statistics released by the NEA.
The NEA omitted this data from its May release, which led to speculation from Bloomberg and Reuters that the reason would be poor numbers for wind and solar. This proved to be largely untrue when the data became available directly from the CEC, with solar power utilisation increasing significantly and wind power utilisation falling, but within normal year-to-year variation.
Another dataset, tracking the fraction of solar and wind power wasted due to grid inflexibility, showed small increases of 0.8 percentage-points for solar and 1.7 points for wind. This is problematic for plant operators, but well short of a spike that would notably affect the utilisation numbers – they typically vary by more than 5% from year to year.
There is now enough data to work around the limitations in the NBS power generation data and give a complete picture of China’s power generation mix in May.
The first thing to note is that the NBS numbers are normalised to a 30-day month, which accounts for a fraction of the mismatch. The rest of this article uses normalised 30-day numbers.
Instead of using the NBS numbers, it is possible to estimate generation from solar and wind based on reported capacity and utilisation. Combining these estimates with reported generation for other technologies yields total generation of 783TWh and year-on-year growth of 8%.
Reported electricity consumption of 750TWh – when normalised to a 30-day month – is consistent with estimated generation of 783TWh, with the 4.2% difference being due to transmission losses.
Monthly data on transmission losses is not available, but the average for 2023 was 4.5%, matching closely with the difference between reported consumption and estimated generation.
Record results
Putting the various figures together shows that, far from the modest 29% year-on-year increase in the incomplete NBS data, there was a record 78% rise in solar generation in May 2024.
Installed solar capacity increased by 52% to 691 gigawatts (GW) and capacity utilisation improved from 16% to 19%. This delivered the largest increase in China’s electricity generation for any technology, with solar generation rising 41TWh from 53TWh in May 2023 to 94TWh in May 2024.
The second-largest increase was from hydropower, where capacity only increased 1%, but utilisation jumped from 31% to 41%, as the sector recovers from the record drought seen in 2022-23. This led to a 39% or 34TWh increase in power generation, which hit 115TWh.
Wind power saw a strong increase in capacity of 21%. Utilisation fell, however, likely due to month-to-month variations in wind conditions. As a result, power generation grew by a relatively modest 5%, or 4TWh, reaching 83TWh. Nuclear and biomass-fired power generation also saw small increases in capacity, but the utilisation of nuclear plants fell from 87% to 85%.
In total, clean power generation grew 78TWh, as shown in the figure below. This was more than enough to exceed the 49TWh increase in demand.
As a result, gas-fired generation plummeted by 16%, despite a 9% increase in capacity, driving a steep 24% drop in utilisation. Coal-fired generation capacity increased by 3% while power generation from coal fell 3.7%, resulting in average plant utilisation falling by 7%. Falling demand could temper investment in new coal capacity, which has run hot in the past two years.
The changes in coal and gas-fired generation, combined with a slight degradation in the thermal efficiency of coal-fired power plants, imply a 3.6% drop in CO2 emissions from the power sector.
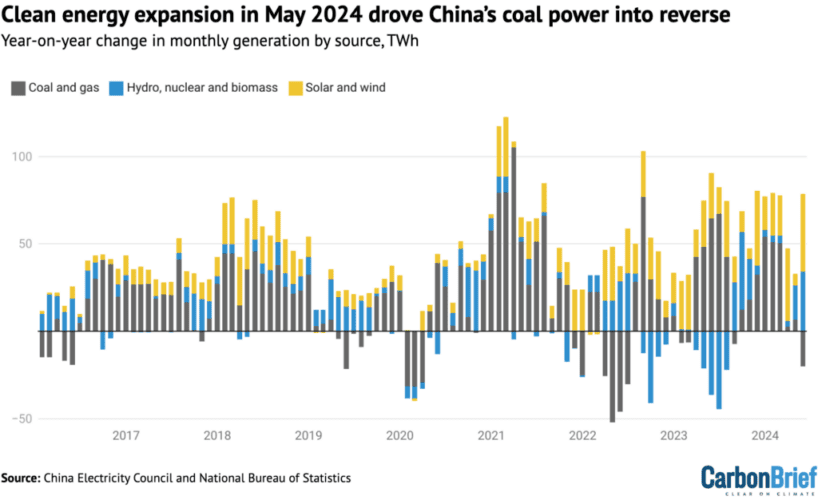
Year-on-year change in China’s monthly electricity generation by source, terawatt hours, 2016-2024. Source: Wind and solar output, and thermal power breakdown by fuel, calculated from capacity and utilisation reported by China Electricity Council through Wind Financial Terminal; total generation from thermal power and generation from other sources taken from National Bureau of Statistics monthly releases. Chart by Carbon Brief.
After these changes in output, China’s power generation mix shifted significantly away from fossil fuels in May 2024. The share of coal-fired generation fell to 53%, down from 60% at the same time last year and the lowest share on record, as shown in the figure below.
Meanwhile, solar rose to 12%, up from 7% a year earlier and the highest on record. The remainder was made up of wind (11%), hydropower (15%), nuclear (5%), gas (3%) and biomass (2%).
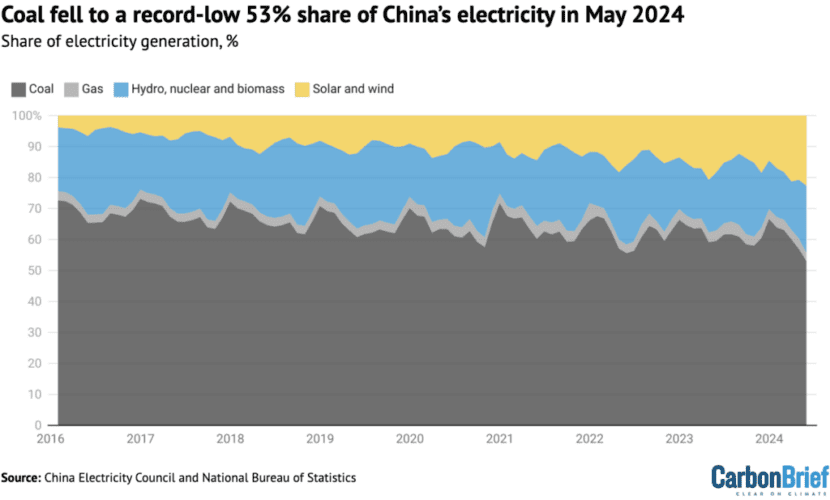
Share of China’s electricity generation, %, 2016-2024. Source: Wind and solar output, and thermal power breakdown by fuel, calculated from capacity and utilisation reported by China Electricity Council through Wind Financial Terminal; total generation from thermal power and generation from other sources taken from National Bureau of Statistics monthly releases. Chart by Carbon Brief.
The overall non-fossil energy share was a record 44% and there was also a new record-high share for variable renewable – solar and wind – which reached 23%.
Solar and wind are gaining share in China’s power mix very rapidly, despite rising demand, as shown in the figure above. In May 2016, they accounted for just 7% of the total.
Meanwhile, strong clean-energy capacity growth continued in May 2024, with 19GW of solar being added, 3GW of wind and 1.2GW of nuclear.
In the first five months of 2024, China has added some 79GW of solar and 20GW of wind. These additions are up 29% and 21% respectively from last year’s numbers, which were already record-breaking, as shown in the figure below.
Looking at solar specifically, monthly additions in May 2024 were higher than the previous month of April and also increased year-on-year compared with May 2023.
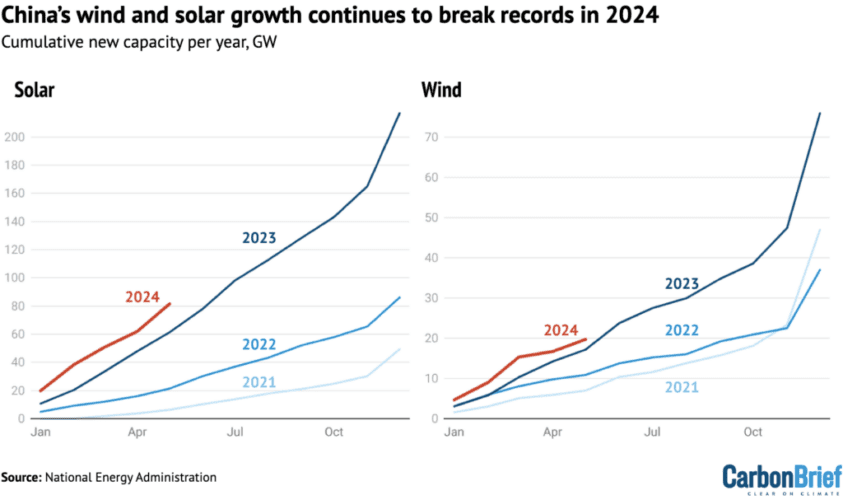
Newly added solar and wind power capacity from the beginning of each year, GW, cumulative at the end of each month. Source: National Energy Administration monthly releases.
The rapid growth in power generation from solar shows that the solar capacity boom is delivering new electricity supplies at a scale sufficient to cover much of China’s demand growth.
This reinforces the view that China’s CO2 emissions are in a period of structural decline.
If clean energy additions are kept at the level reached in 2023 and early 2024, then CO2 output is likely to keep falling, which would confirm 2023 as the peak year for the country’s emissions.
With China due to announce new climate targets by early next year, the government’s level of ambition for clean energy growth remains an open question.
About the data
Wind and solar output, and thermal power breakdown by fuel, was calculated by multiplying power generating capacity at the end of each month by monthly utilisation – the proportion of maximum possible output – using data reported by China Electricity Council through Wind Financial Terminal.
Total generation from thermal power, hydropower and nuclear power was taken from National Bureau of Statistics monthly releases. Monthly utilisation data was not available for biomass, so the annual average of 52% for 2023 was applied.
CO2 emissions from power generation were calculated by applying emissions factors from China’s latest national greenhouse gas emissions inventory, for the year 2018, as well as the monthly average coal power plant heat rate reported by National Energy Administration, and by assuming average thermal efficiency of 50% for gas-fired power plants.
This article was originally published on Carbon Brief. Reproduced with permission.

