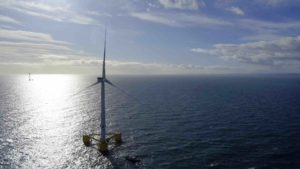
During the past week, we helped Giles Parkinson post this article noting that wind farm output had reached 2,988MW as a new record (higher than what we saw over summer 2014-15, for instance).
On Sunday I noticed that, in the quiet of the night, wind output had roared along and peaked at 3,215MW in the 00:05 dispatch interval (meaning metered generation output measured at 00:00 leading into Sunday). This point in time is shown in the following snapshot from NEM-Watch v10 (using “Playback” to reset the display to how the market looked back at that time):
This represented about 16% of the Scheduled Demand Target used by AEMO in dispatching the market:
However note that:
1) this is not a correct measure, strictly speaking, as some of the wind output is non-scheduled, so nets off Scheduled Demand – the real percentage would be somewhat lower than this).
2) also note that demand around midnight is being inflated by off-peak hot water load in South Australia, and that (more generally) demand does not reach its low point across the NEM until around 4am each morning.
The above, however, is indication of how the latest projects added to the grid late in 2014 are contributing to the increased output.
Continuing into this afternoon, we see that the high wind output has continued (though slightly lower) and has been one of the factors delivering very low Scheduled Demand levels across the NEM, and also very low prices – negative in places:
If it’s true that the political argy-bargy over the RET target is closer to resolution (not withstanding the latest political point-scoring shenanigans) then this is the type of thing we might be seeing much more of in the years ahead to 2020.
Source: Watt Clarity. Reproduced with permission.


