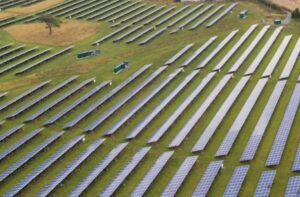
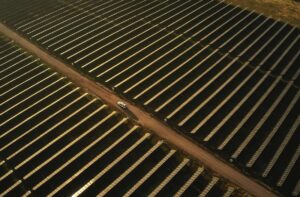
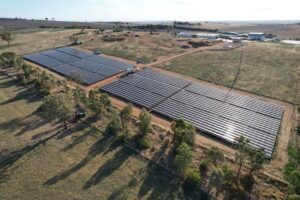
The rapidly emerging large-scale solar sector achieved a significant milestone on Sunday, October 21, when the combined output of all utility-scale solar farms in the National Electricity Market broke through the 1GW barrier for what is believed to be the first time.
According to this graph below sent to us by Mike Hudson, using data he sourced from the Australian Energy Market Operator, the 1GW level was first breached in mid morning, and continued until almost 3pm in the afternoon.
 That consistency of output is a key point – many solar detractors think that the output of solar farms peaks at around 12pm or 1pm and falls off rapidly after that. Most solar farms, thanks to single axis tracking technology, reach peak output around 9am, and stay around that level for six hours.
Sometimes they do better than that. The AEMO data shows, for instance, that the Bungala solar farm in South Australia reached 105.2MW at 8.05am grid time, (which is the same as Queensland time), and stayed there until 3.20pm.
So far, only the first stage of the 110MW Bungala solar farm – located near Port Augusta, not far from the site of the state’s last coal fired generator, is in operation. When the second stage is complete, it will be the biggest solar farm in the country.
In the above graph, the blue line represents the output from NSW, the red line is Queensland, the thick red line is South Australia and the blue line is Victoria. The black line at the top is the combined output.
 Here is another view of the output, from OpenNem.org.au. The slight difference in data is explained by the inclusion, or not, of some smaller sub 10MW solar installations.
This 1GW figure could likely double within a year, given the number of solar farms that have already connected, but are not yet operating at full capacity, and those nearing completion.
In all, according to Clean Energy Regulator data, some 4,000MW of solar is completed, under construction, or has reached financial close. That should add to some of the mid-day negative pricing that were again observed in Queensland last week.
It should be noted that this data includes the NEM only. There are two operating solar farms in W.A.’s separate grid, and many smaller utility scale solar farms located in off-grid locations in W.A., Northern Territory and Queensland.


