(See also our update on how wind energy met 91 per cent of demand in South Australia on Wednesday morning).
It’s been a big week for wind energy. First was the admission by Tony Abbott’s modellers that the renewable energy target as is will reduce electricity bills, and that the target could be met. Then there was Clive Palmer’s vow of support from his three Senators.
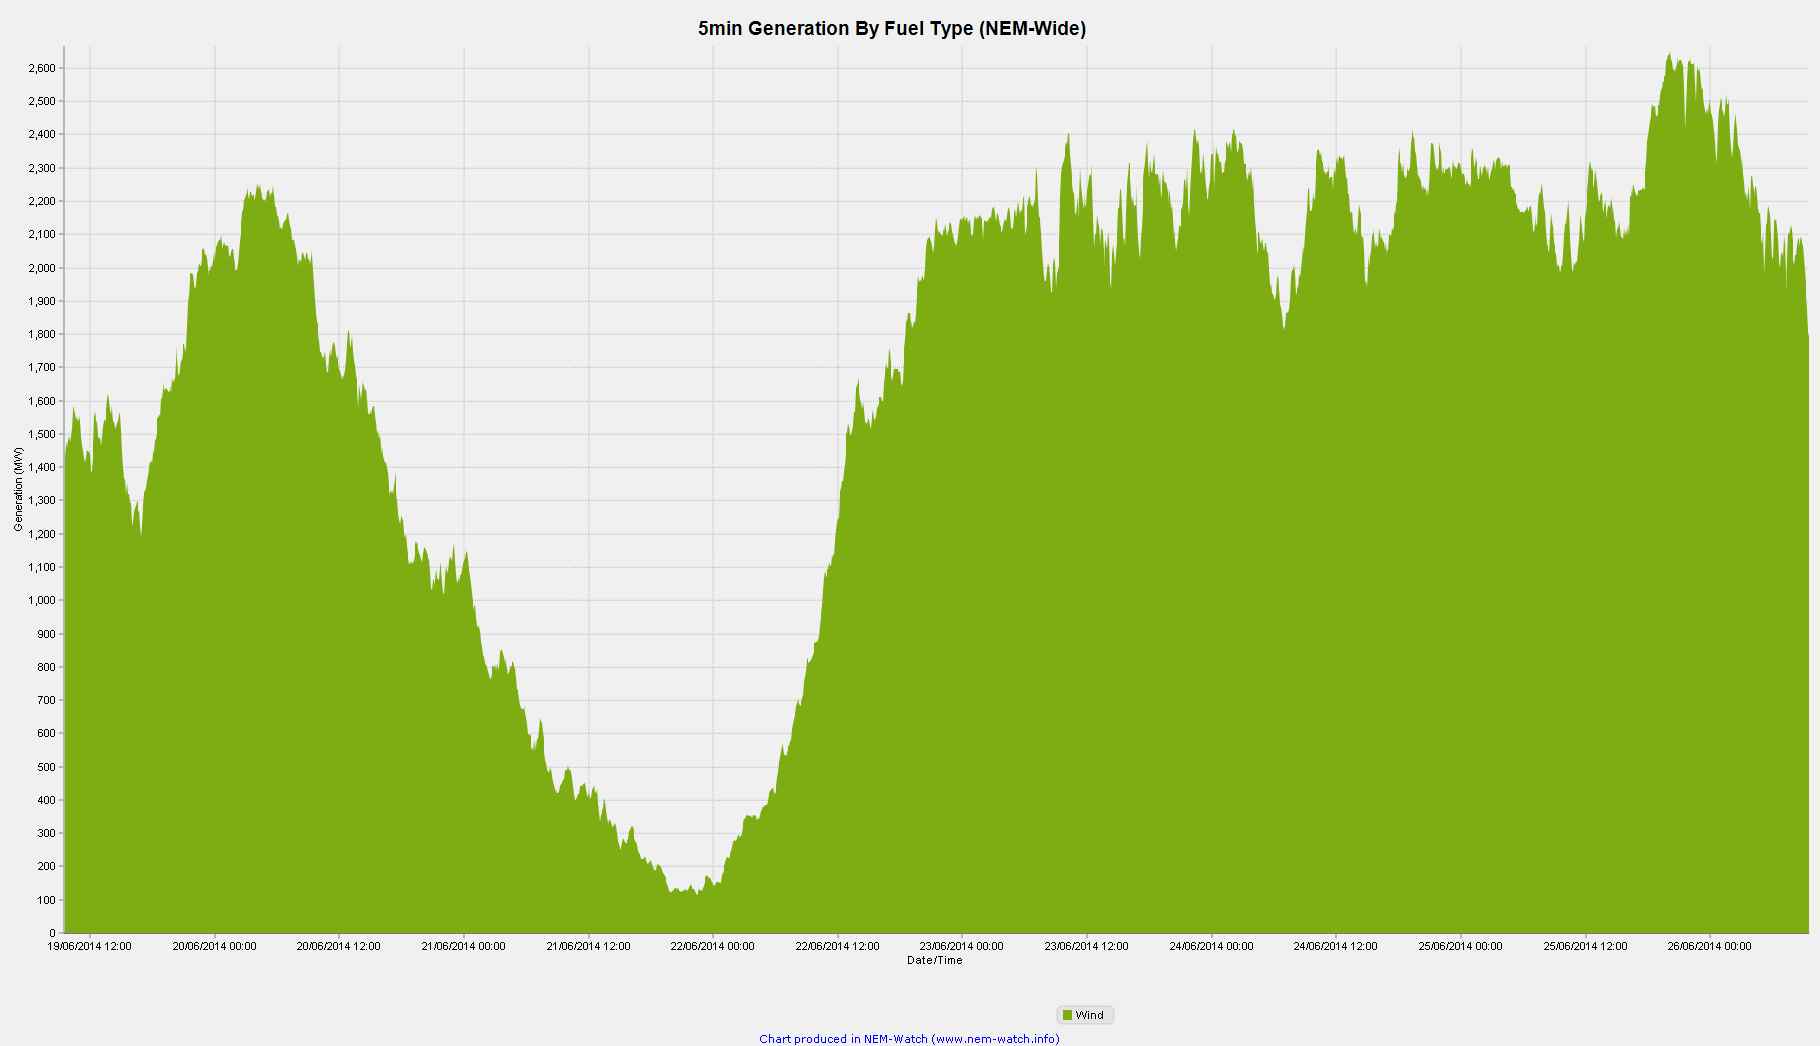
It’s also been very windy. So much so, that for a period of more than three days, wind energy in South Australia has provided two thirds of total generation in the state. Over that period, nearly all the wind farm’s in the state have been operating at full capacity, as these graphs from NEM-Watch” show.
Hugh Saddler, from Pitt&Sherry, says that in South Australia, wind contributed an average 64 per cent generation over the three days from Monday to Wednesday. Coal was relegated to just 9 per cent.
Across the National Electricity Market, which extends from South Australia and from Tasmania to Queensland, Saddler says wind generated 11 per cent of electricity across t for the 72 hours from Monday to Wednesday, lifting the share of renewables to 22 per cent (not including rooftop solar) and relegating the share of black and brown coal to just 65 per cent.
These figures include Queensland, which has negligible wind generaton and very little hydro. Shares of renewable generation across the four south eastern states would have been higher – at 14 per cent wind, and 28 per cent renewables for the three days. 
(See also our update on how wind energy met 91 per cent of demand in South Australia on Wednesday morning).


