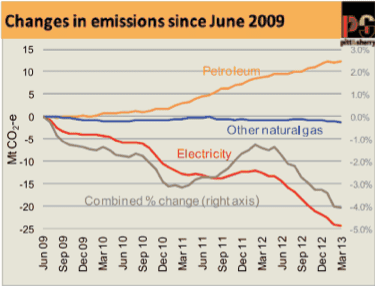
May 2013 has marked the 13th successive month in which Australia’s annualised carbon emissions fell, with total emissions for the year ended March 2013 coming in at 2.7 million tonnes CO2 lower than in the year ended December 2012 and nearly 9 million tonnes lower than in March 2012 (Figures 1 and 2).
According to the latest Pitt & Sherry CEDEX report, this more or less follows the established pattern of the last three years, with falling electricity generation emissions more than offsetting growth in emissions from petroleum fuels, while emissions from non-electricity natural gas use remained almost unchanged.
“Given the annualisation procedure,” says the report, “this reflects changes in patterns of energy supply and use extending back to mid 2011. The carbon price introduced in July 2012 is therefore not the only driver of reduced emissions, but it has probably helped to reinforce a trend already underway.


