A new report from global reinsurance giant Swiss Re has found that the insurance industry had its third-most expensive year on record in 2012, with global economic losses from natural and man-made disasters totaling $US186 billion. The report, released last week, found that extreme weather events in the US were behind some of the most expensive disasters of 2012, with Hurricane Sandy alone costing an estimated $70 billion in total damage and $35 billion in insured losses. The protracted US drought and summer heat waves lead to in insured agricultural losses of $11 billion – the highest loss in the history of agriculture insurance.
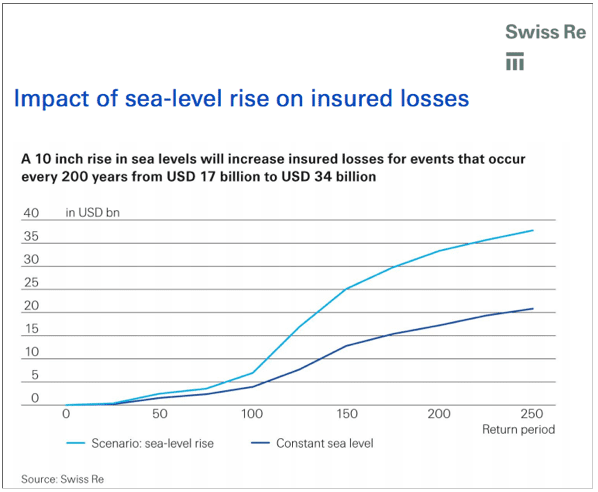
Looking ahead – and to the subject of today’s Graph of the Day – the report has estimated that a 10-inch rise in global average sea levels by 2050 would nearly double the probability of extreme flood losses. “For the industry, this means that a $20 billion insured loss event, now expected once in 250 years, would be expected once in 140 years,” Swiss Re said in a press release. As Andrew Freedman notes on Climate Central, Swiss Re says a 10-inch increase in sea level by 2050 is considered a conservative estimate, as it does not include the effects of a potentially rapid melt of land-based ice sheets in Greenland and Antarctica.

Source: US dominated global disaster losses in 2012: Swiss Re


