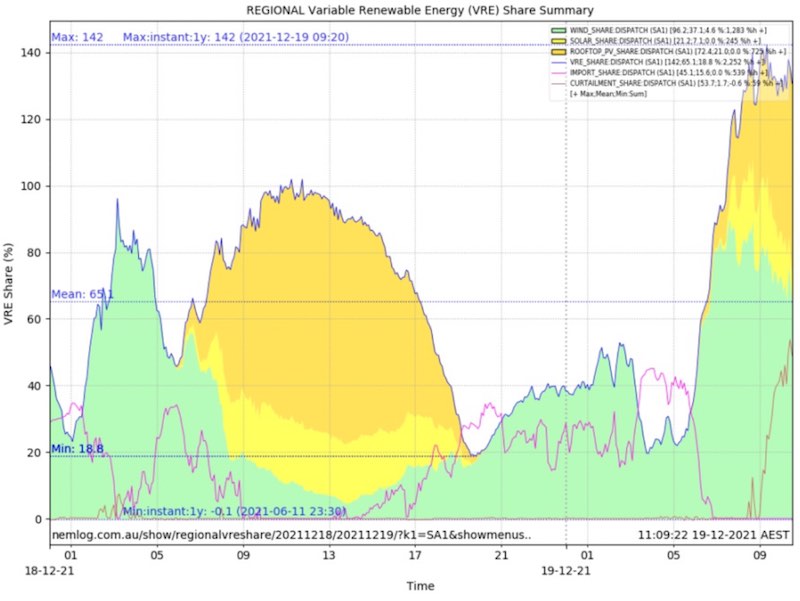
Wind and solar, newly liberated by the introduction of new grid protocols in South Australia, have set a new record share of local demand – reaching a peak of 142.3 per cent on Sunday morning.
The new record share of local demand – documented by data analyst Geoff Eldridge of NEMlog, beats the previous record of 137.3 per cent – and comes amid reduced gas generation and increased exports to Victoria.
The Australian Energy Market Operator has significantly reduced the need for gas generators to operate in the background at times of high wind and/or solar output in South Australia, thanks to the commissioning of four synchronous condensers that can provide much of the system strength originally sourced from gas.
That means that the “directions” and “interventions” issued by AEMO can be vastly reduced, and the amount of wind and solar allowed to export to the grid to be significantly increased at certain times.
The construction of a new interconnector to NSW (due to be completed in 2025) and more battery storage – particularly those with “grid forming inverters” – is expected to pave the way for even greater share of renewables, because it will allow more to be exported and require even less gas generation.
The record of 142.3 per cent occurred over a five minute trading interval at 9.20am (grid time, or AEST) on Sunday. AEMO confirmed that the average over the 30 minute interval to 9.30am was 134.4 per cent, and that five minute numbers would be higher than that.
At the time, there was only 82MW of gas generation with more than 2,250MW of output from large scale wind and solar, and rooftop solar. That’s a share of 96.2 per cent of total generation in the state, but with 540MW being exported to Victoria, it translated into a record 142.3 per cent of state demand.
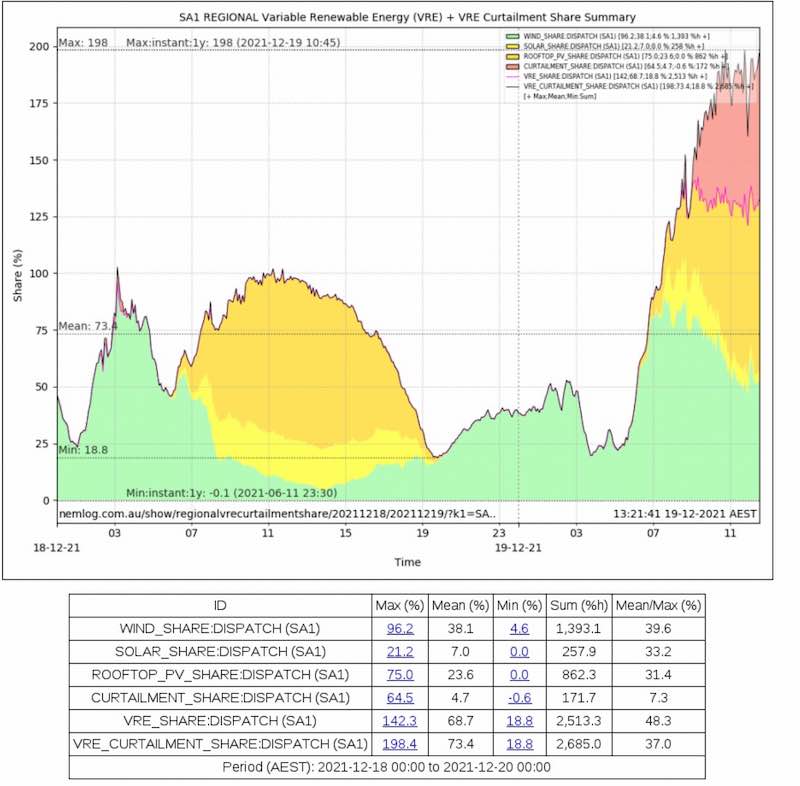
That percentage might have gone higher later in the morning, but there was simply not the demand, nor the capacity to either store the excess wind and solar, or export it to another state, and at 10.45am grid time the amount of curtailment soared (in red in graph above).
According to Eldridge, the maximum Instantaneous wind and solar plus curtailment share leapt to a record 198.4 per cent, up 1.12 per cent from the previous record of 197.2 per cent at 1.55pm on Sunday, November 11.
In effect, the state was producing twice as much wind and solar at the time as it needed. Heavy levels of curtailment will continue until that new transmission line is built to NSW, and there is either more storage or more demand created by renewable hydrogen projects (although the latter is a few years off yet).

