A new solar forecasting tool can predict the daily output of distributed solar generation systems across the various states of Australia up to a 90 per cent probability.
The tool, recently integrated into the University of New South Wales-developed APVI Live Solar Map, allows solar system owners to estimate how their PV generation will track over the rest of the current day.
As you can see in the image below, the tool displays the performance of PV systems (represented as a percentage of their rated capacity), and produces a forecast of their expected power output over the remainder of the day.
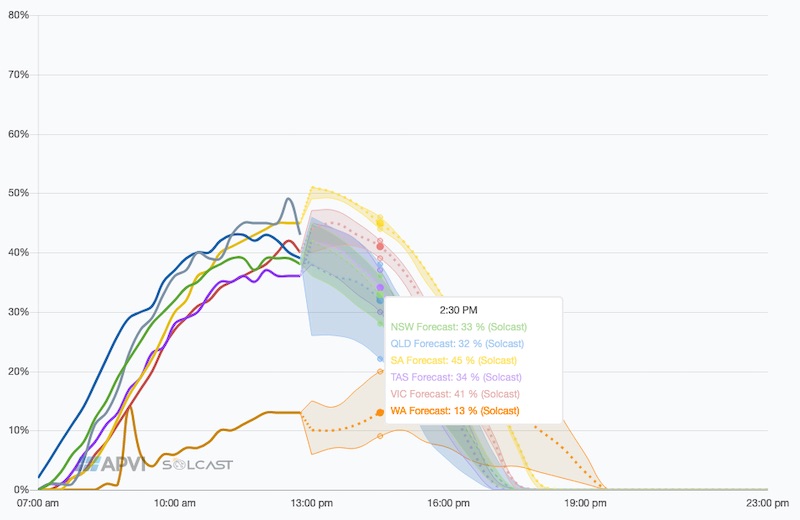
APVI says the predictions include both a 90 per cent and 10 per cent probability range, which appears as the shaded regions around the median forecast (dotted line).
The new feature is part of an upgraded version of the APVI live distributed PV generation estimates which now include data provided by solar forecasting company Solcast.
The project, which was backed by the Australian Renewable Energy Agency, is partnered with the APVI, and has been exploring the use cases for solar data services by low voltage network operators.
“Our aim in providing the new forecasting data, is to build awareness around solar forecasting technologies and their capabilities” Dr Nick Engerer, lead on the ARENA project, says.
“Solar forecasting is a key enabler for integrating higher penetrations of rooftop solar into Australian electricity networks”.
Increasing the allowable penetrations of rooftop solar PV was identified as a key project outcome for the ARENA project that funded this work.