
China is installing one wind turbine an hour – according to a new analysis of the latest data on the country’s startling state-backed renewables boom.
The analysis comes as China – alongside the US – moved to ratify the Paris climate treaty.
China’s coal use fell for the second year in a row in 2015, with 2016 on track to be the third – though it remains the largest source of energy; causing an estimated 370,000 premature deaths from air pollution in 2013.
But it’s China’s use of renewable energy that is really changing.
1. Power generation from wind and solar increased more than China’s total electricity demand in 2015.
So yes, energy demand in the world’s largest economy is growing but this new data means that all new demand was covered from these sources.
In detail that means:
Electricity consumption in China rose 0.5% from 2014 to 2015, from 5522 TWh (terawatt-hours) to 5550 TWh.
At the same time, electricity generated from wind and solar sources increased by 21% and 64%, respectively, covering off the rise almost twice over.


China added 31 gigawatts of wind power capacity in 2015, which is equal to 10,000 large turbines, or more than one large wind turbine every hour of the year.

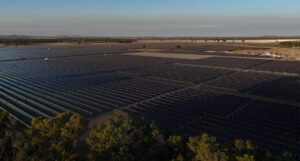
5. The surface area of solar panels installed in China in 2015 is equal to over 10,000 football pitches. That’s more than one football pitch per hour, every hour of the year.
6 China’s targets a similar pace of wind and solar growth in its 2020 renewable energy targets. This will mean adding approximately the entire electricity demand of UK from wind and solar in just five years.
Source: Energy Desk. Reproduced with permission.