As early as 2013, the California Independent System Operator (CAISO) was predicting that with so much new solar generation expected by 2020, the mid-day hours on sunny days would be inundated with a flood of solar power, displacing thermal generation.
CAISO was originally most concerned about the sunny spring days when California’s demand tends to be low due to cool temperatures while solar generation could be high.

The grid operator was also concerned about the late afternoon ramping required to make up for the loss of solar generation as sun sets with peak demand following in early evening hours. The so-called California duck curve (left) has become well-known around the world. Similar patterns are now common in other countries, including Australia, for example.
That was before the state lawmakers passed a bill to raise California’s renewable portfolio standard (RPS) from 33% by 2020 to 50% by 2030, promptly signed by Governor Jerry Brown, who is as green as you can get despite his brown name.
As it turns out, CAISO was spot on in predicting the deepening belly of the duck but under-estimated the speed of solar uptake by at least 4 years. The data from March-April of 2016 confirms that the belly of the duck is getting fatter much earlier than originally estimated.
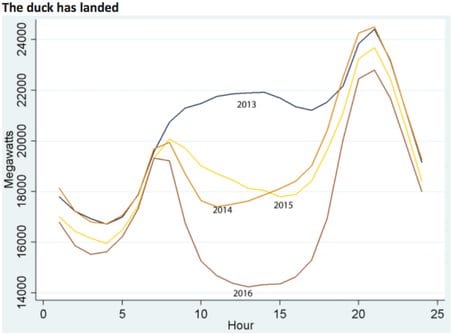
In a Blog titled “The Duck Has Landed” posted on 2 May 2016, Meredith Fowlie of University of California at Berkeley examined the hourly data for the period March 28 to April 3 for 2013-2016 and as illustrated in the graph below, the 2016 belly is far more pronounced that in prior years and already on par with what CAISO had projected for 2020.
In her Blog, Fowlie notes,
“In the 2016 duck season, we saw mid-day net loads at or around predicted levels. Increased solar penetration on both sides of the meter (utility scale and distributed) has been driving net loads down when the sun is up. Fortunately, the ramp from 5 – 8 pm has not been quite as steep as projected because electricity demand in the evening hours has been lower than projected. Perhaps this is due to unanticipated demand-side energy efficiency improvements.”

With the new 50% RPS for 2030, California’s renewable march to green nirvana is set to accelerate, making the duck even fatter by 2030 – which explains why CAISO, in collaboration with the regulator, California Public Utilities Commission (CPUC) and other stakeholders is embarking on an ambitious agenda to prepare for the challenges imposed by variability of so much new renewable generation added to network over a relatively short span of time.
 CAISO’s current energy mix (visual on right), already clean and green, will become even more so over time. Coal, virtually nil and historically imported from out of state, will essentially be phased out entirely, while renewables’ portion will continue to increase by 2030. Solar’s contribution already exceeds that of wind and expected to continue to grow.
Adding behind the meter or distributed solar – that is rooftop solar PVs on customers’ houses, office buildings, car parks, schools, etc. – will further eat into thermal generation and utility
revenues and CAISO’s net load. The growth of this embedded generation is completely hidden from CAISO, who must increasingly guess how much its net load – that this the amount it should dispatch from central plants under its control – is going to be.
In this context, among the challenges facing CAISO is what to do with the minimum load problem. The grid operator is already approaching the forbidden zone – that is hours during mid-day when net load is dipping into resources that it cannot easily ramp down, turn away or reject for variety of contractual, operational and other reasons.
Nuclear, combined heat-and- power (CHP), contracted QFs, geothermal, biomass and biogass and a number of other generation resources either cannot ramp down or have binding contracts that allows them to operate at full throttle even if CAISO does not need their output.

The mid-day dip, shown for 2013 and 2015 is expected to get much worse by 2021, eventually cutting into these types of generation.

And yet the peak demand remains peaky and potentially getting worse (see above). As recently as February 2016, CAISO experienced roughly 11 GW of ramping capacity during a 3-hour period to meet peak demand. The same graph shows actual net load experienced on 24 April of around 12 GW – more or less in line with what was projected for 2020. This is the same point illustrated by Fowlie in her Blog.
The other challenge will be how to avoid curtailing zero cost, green renewables during times when there is simply too much supply and too little demand.
During the hot summer months, when demand peaks in California, usually in July-Sept, virtually all renewables, solar, wind, hydro, geothermal, biomass, biogass, are used and useful. As illustrated in the graph on, for the month of August, typically a peak demand period, there is no need for curtailment as all the generation is typically needed to run the state’s massive air conditioning load.

But spring and early summer months of March-June may prove difficult. Under a 40% RPS scenario by 2024 – roughly in line with what it will take to reach 50% RPS by 2030 as mandated under current law – CAISO is projecting massive amounts of surplus capacity on many days. The over-generation goes as high as 13-14 GW on some days as illustrated in this simulation.

This is explained not only by ample sunshine in the spring and little demand, since there is no cooling load to speak of, but also because spring months tend to be windy and wet, with lots of run-of- the-river hydro and wind flooding an already saturated renewable energy bonanza.
So what is CAISO doing to prepare for this fast approaching future? Broadly speaking 4 major ideas are being explored:
- Encouraging more flexible ramping generation resources, the type that can fill the 13 GW ramping requirements in 3 hours to meet peak evening demand;
- Increased reliance on existing pumped storage while expanding other kinds of storage both utility-scale and behind the meter including the mandated 1.3 GW of storage already in the works;
- Expanding CAISO’s footprint – a central component of the energy imbalance market (EIM) – which allows increased reliance on capabilities of the regional network to export/import the shortfall/excess supply to neighboring states when feasible and economical to do; and
- Increased reliance on retail tariffs to encourage load shifting and demand curtailment through more sophisticated rate structures including time of use (TOU) and real-time- pricing (RTP).

Curtailment of renewables will be attempted only as a last resort, if all else fails.Many believe that the arrival of affordable utility-scale or distributed-scale storage will save the day. A large fleet of electric vehicles charged at proper times, for example, will be a big help. Chilled water storage systems will also make sense. As will prices that better reflect the scarcity or abundance of generation in different seasons and times of day.
CAISO is collaborating with CPUC, the utilities and other stakeholders to design retail rates that will be sorely needed to encourage consumption during certain times while discouraging it at others as illustrated in visual on bottom of page 13.
All of these efforts, and more, will, of course, be needed. For now, a lot is riding on the fate of CAISO’s expanding EIM (map on right).

Many experts are convinced that it will be a matter of time and necessity for a much bigger regional wholesale market to emerge, one that may eventually cover substantial parts of the Western US, possibly with a different name and organizational structure acceptable to a wider group of stakeholders who are skeptical of CAISO being California-centric. It is a valid concern and one that needs to be addressed sooner rather than later.

That will take time, and patient perseverance. All indicators, however, are that the benefits will outweigh the costs. But convincing the various stakeholders will take some effort with the sovereignty of various states and the governance of the emerging organization at its core.
Other regional wholesale markets in the US, most notably PJM, MISO and SPP have grown substantially over time to cover large multiple state parts of the US, and in the case of MISO, extending into Canada (map above). There is no reason a similar approach will not work in the West.
Perry Sioshansi is president of Menlo Energy Economics, a consultancy based in San Francisco, CA and editor/publisher of EEnergy Informer, a monthly newsletter with international circulation. He can be reached at [email protected]