The coming of the renewable energy revolution has long been heralded by many of the world’s energy market authorities, and as solar and wind energy capacity is installed at record rates, these predictions seem to be being borne out.
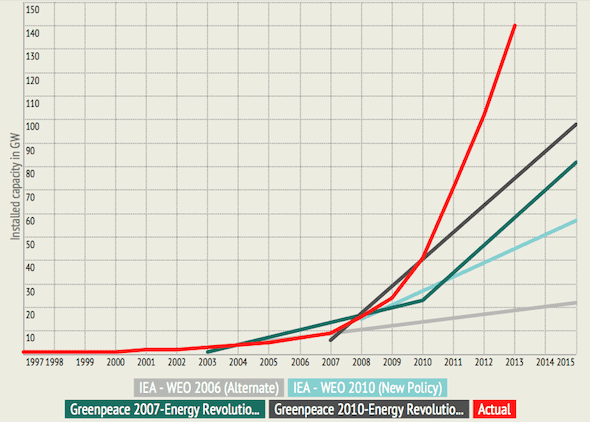
But a new infographic published by Meister Consultants Group has shown that almost all of these expert predictions have vastly underestimated the scale at which the renewable energy revolution would happen.
As the first two charts below show, out of a number of predictions made by authorities including the IEA and the US Energy Information Administration over the past 15 years, only the most aggressive growth projections, such as Greenpeace’s Energy [R]evolution scenarios, have been even close to accurate on the actual scale of growth in installed solar and wind power.
Chart one: Cumulative installed solar PV capacity: Global

Chart two: Cumulative installed wind capacity: Global

As the report puts it, “renewable energy growth has consistently surprised (on the upside) the analysts, planners, and policy makers who have attempted to predict the future.”
Greenpeace’s projections, it notes, were based on drastic structural, policy and business changes – the sort that recent moves by E.On, China and countless other local and global institutions suggest are already underway.
As for where this boom is headed – and how fast – projections and scenarios range from 15 per cent of global primary energy demand by 2050 (Greenpeace’s reference scenario) to 82 per cent (Greenpeace’s Energy Revolution scenario). If Greenpeace continues its track record of accuracy, we’re in for a wild ride.
Chart three: Projected renewables share of global primary energy demand: All renewable energy sources 


