Graph of the Day: Cities under water at 2°C and 4°C

Around half a billion people are at risk from sea level rise if the world continues on a business-as-usual path for carbon emissions, a new report has found – while limiting warming to the recommended 2°C would cut this risk by more than half.

The US report by Climate Central, accompanied by an online interactive mapping system, shows that carbon emissions causing 4°C of warming – what business-as-usual points toward today – could lock in enough sea level rise to submerge land currently home to 470 to 760 million people as the “unstoppable rise” unfolds over centuries.

The research also reveals, however, that aggressive carbon cuts limiting warming to 2°C could bring the number as low as 130 million people.

The report – authored by Climate Central scientists Benjamin Strauss and Scott Kulp, and Anders Levermann of the Potsdam Institute for Climate Impact Research – assesses implications for all coastal nations and cities – post-2100 – using relationships between warming caused by carbon emissions, the long-term global sea level rise it locks in, and global elevation and population data.

The news is worst for China, which is found to be most at risk with 145 million people living on land ultimately threatened by rising seas if emission levels are not reduced. Below are the mapped projections for Shanghai, at 4°C on the left, and 2°C on the right.

China also has the most to gain from strong emissions reduction, with 2°C found to cut the “at risk” total of people to 64 million. Twelve other nations each have more than 10 million people living on land at risk, led by India, Bangladesh, Vietnam, and Indonesia.

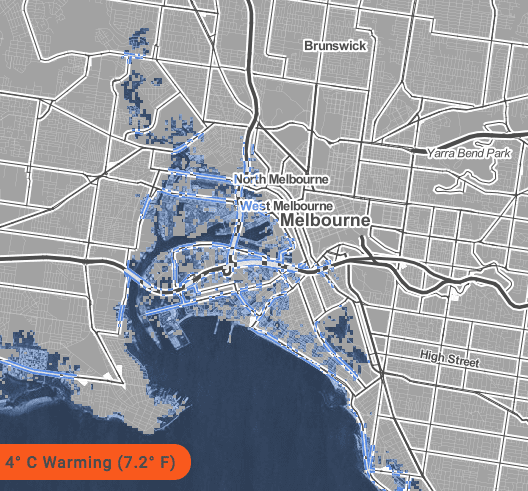
As for Australia, the report finds that 4°C warming would put 1.9 million inhabitants on land in danger, compared with 668000 at risk from 2°C.

Sydney, alone – as you can see in the selection of maps, below, of Sydney and surrounds – has 218,000 on land at risk (0.06 percent of the greater urban area population) after 4°C of warming. And 90,000 in the case of 2°C warming. Median projections of locked-in sea level rise are 8.4 meters for 4°C and 4.4 meters for 2°C.

As you can also see in the first Sydney map, Point Piper – home to the current residence of Prime Minister Malcolm Turnbull, circled in red – is in trouble either way. Although it will be someone else’s problem by then.

The Victorian coastal home of federal environment minister Greg Hunt – the Mornington Peninsula town of Mount Martha – might also be in a spot of bother, if we don’t manage to limit warming to 2°C.

Screen Shot 2015-11-09 at 11.03.49 am

As the report’s authors note, the sea level rise to realise these threats will likely unfold over 100s of years, but emissions this century can lock in one path or another.

“The global stakes of climate change are crystal clear with sea level rise,” said Benjamin Strauss, vice president for Climate Impacts at Climate Central and the lead author of the report.

“The outcome at Paris can point us toward losing countless great coastal cities and monuments around the world, unending migration, and destabilisation, or toward preserving much more of our global heritage, and a more stable future,” he said.

Levermann, co-chair of the Research Domain Sustainable Solutions at the Potsdam Institute for Climate Impact Research in Germany, added,”sea-level rise is nothing to be afraid of, because it is slow, but it is something to be worried about, because it is consuming our land, including the cities in which we create our future heritage today.”

Comments

13 responses to “Graph of the Day: Cities under water at 2°C and 4°C”

  1. suthnsun Avatar
    suthnsun

    Antarctic Ice Sheet has huge potential to vary from these older projections, an acceleration seems to be happening now. If this continues the timeframes will contract dramatically.

  2. Pedro Avatar
    Pedro

    Atlantas in our lifetimes. Every continent gets at least one.

  3. des_reputable Avatar
    des_reputable

    Heres an article for some balance from Nov 6:
    http://quadrant.org.au/opinion/doomed-planet/2015/11/king-canutes-climate-science/

    “NASA found that the Antarctic as a whole was gaining, not losing, mass.[v] NASA announced, The research challenges the conclusions of other studies, including the Intergovernmental Panel on Climate Change’s (IPCC) 2013 report, which says that Antarctica is overall losing land ice.

    “According to the new analysis of satellite data, the Antarctic ice sheet showed a net gain of 112 billion tons of ice a year from 1992 to 2001. That net gain slowed to 82
    billion tons of ice per year between 2003 and 2008.”

    Furthermore, they make the point that NOAA historical data for sea levels does not support them rising as the IPCC would like.
    http://tidesandcurrents.noaa.gov/sltrends/sltrends_global_country.htm?gid=1275
    I think whatever is going on, there is an element of “follow the money” in both a) mining coal/oil uranium and b) exploiting artificial market carbon “bubbles”

      1. des_reputable Avatar
        des_reputable

        Yes, it’s talking since 1979, which is a tiny time period when talking greater periods, which could be cyclical. Regardless of any net global ice loss, the sea level observations are not necessarily following, according to the other link I posted. Lots of nice year to year comparison arctic snapshots for those interested, here:
        http://igloo.atmos.uiuc.edu/cgi-bin/test/print.sh?fm=10&fd=16&fy=2012&sm=10&sd=15&sy=2015

    1. Alastair Leith Avatar
      Alastair Leith

      your cynicism is no match for your lack of understanding of the elementary aspects of climate science. suggest you work you way through the myths on Skeptical Science. You’ve deployed a few here.

      1. des_reputable Avatar
        des_reputable

        Here’s a nice local analysis of some Pacific islands sea level rise – it’s there, but its certainly not simple. Follow his logic and data, and see if you can find fault with the conclusion that it is to do with wind long-term pattern changes.
        We don’t all have to drink the Kool-aid.
        https://kenskingdom.wordpress.com/2015/11/01/pacific-sea-levels-warming-enso-or-wind/

        1. Alastair Leith Avatar
          Alastair Leith

          are you suggesting I drink kook-aid for accepting the findings of every science academy and climate institute in the world? I’ve taken two 6-8 week MOOCs on Climate Science — the scientific consensus of the IPCC position that human induced climate change is happening and that it’s already very dangerous (soon to be extremely dangerous) is extraordinarily high.

          Are you a run of the mill denier or just a sea level rise denier?

          1. des_reputable Avatar
            des_reputable

            Should we accept every word of authoritative ‘accepted’ science without question? No, otherwise we’d all be taking thalidomide for morning sickness.

    1. des_reputable Avatar
      des_reputable

      There’s also this early record of arctic sea ice – seeming to show it was lowest in 1974. See what you think. http://3.bp.blogspot.com/-IB8Qre5PrXA/VcwwjFeBN0I/AAAAAAAASv8/35pCbec58cg/s400/screenhunter_170-jun-15-11-10.jpg

  4. Ian Avatar
    Ian

    These maps are assuming a nice gradual flooding of low lying coastal areas but the fun won’t stop there, more extreme weather, tsunamis, erosion, tectonic plate movements, unexpected sinkholes in urban areas . Thawing of arctic regions, desertification, read the bible’s Revelations to see the unimaginable apocolypes we could be making for ourselves, a third of everything could be spoilt, misery will abound. The hope is that with a bit of foresight and action we can delay trashing our living space for a good while yet.

  5. Alastair Leith Avatar
    Alastair Leith

    also consider these points:
    storm events and king tides can see flooding events at 100x the S.L. rise difference (NYC and super storm sandy, New Orleans, Philippines Typhoon last year).

    the Western Peninsula of Antarctica has the equivalent of 4m SL rise and the glacial melt is now considered “unstoppable” (the ice that holds all the glacial ice back from the ocean — kinda like a plug — is melting rapidly to point where even establish temp today won’t refreeze it).

    the once considered stable and much larger Eastern Peninsular of Antartica is now considered at risk by most experienced researchers to examine it and in need of much more detailed study. that’s 10m of sea level rise.

    tundra thaw has massive methane bomb potentials and although the global mean temp tipping point(s) are unknown for it’s release of COx and methane, the quantity of frozen GHGs dwarfs the history human GHG emissions.

    Greenland ice volume also massive. All that thawed ice inverts the albedo effect, more positive feedbacks towards other tipping points.

    more info c/o David Spratt’s excellent explainers: http://www.nocarbonbudget.info

Get up to 3 quotes from pre-vetted solar (and battery) installers.