The US government’s greenhouse gas monitoring site at Mauna Loa in Hawaii has confirmed that its average recorded carbon dioxide levels for February topped 400 parts per million (ppm) – the first time that this has been seen in a northern winter month.
Back in May 2013, the Hawaiian site recorded daily levels of atmospheric carbon dioxide at 400 ppm for the first time. Last year the average hit 400 ppm in April, and remained above this level for three months.
So this year, reaching 400 ppm as part of the seasonal ebb and flow of atmospheric carbon dioxide concentrations as early as February is another milestone.
It is likely Mauna Loa’s yearly average will reach 400 ppm this year, as CO2 concentrations climb upwards.
The unit of measurement for carbon dioxide is parts per million (molar) of dry air, or ppm for short. For every million molecules of the gas mixture that makes up dry air, about 400 of them presently are carbon dioxide molecules.
Mauna Loa is one of three key sites identified by the World Meteorological Organisation for long-term carbon dioxide measurements, with a record that started in 1956. The other northern hemisphere site is Alert in Nunavut, Canada (which has been recording since 1975). The third site is in the Southern Hemisphere, at the Cape Grim Air Baseline Air Pollution Monitoring Station in north-west Tasmania, Australia (see below).
It’s all uphill from here
As the graph below shows, CO2 concentrations have climbed relentlessly over the past 200 years. Air and ice measurements allow us to trace the dramatic rise in carbon dioxide levels from about 280 ppm before the start of the industrial era around the year 1800, to a global average of 397 ppm in 2014. That’s an increase of 42%, largely due to human activities.

CSIRO
Atmospheric CO2 concentrations also oscillate throughout the year, reaching a peak in mid-spring in both hemispheres. This is due to the terrestrial vegetation waxing and waning along with the seasons, and is more pronounced in the Northern Hemisphere due to a greater land mass.
During the productive growing phase from mid-spring through summer, vegetation removes considerable CO2 from the atmosphere, while it returns CO2 to the air during cooler months due to ongoing respiration and vegetation decomposition. This phenomenon creates the seasonal cycle in the atmosphere’s CO2 concentration, which can be seen in the graph below showing the last five years of Mauna Loa CO2 data.

CSIRO
What we are seeing at present in the Mauna Loa February measurements are observations fluctuating around 400 ppm. These will return to sub-400 ppm levels later this year (August) when the above-mentioned absorption by vegetation – what’s known as the “annual carbon dioxide drawdown” – will affect Northern Hemisphere atmospheric CO2 levels.
However, by November 2015, Mauna Loa monthly average CO2 concentrations will remain above 400 ppm for the foreseeable future.
Down south
In the Southern Hemisphere, average annual levels of carbon dioxide are measured at the Cape Grim Air Baseline Air Pollution Monitoring Station in north-west Tasmania. This is the third key site identified by the World Meteorological Organisation for long-term carbon dioxide measurements, with a record starting in 1976.
Cape Grim is a key international monitoring facility, operated by the Bureau of Meteorology, and is where much of CSIRO’s international global atmospheric research is centred. Measurements have been made here since 1976.
CSIRO has also measured Southern Hemispheric carbon dioxide over the past 2000 years in air trapped in Antarctic surface ice – called firn – and deeper ice cores, shown in the figure above.
While the northern hemisphere heads towards peak carbon dioxide levels in mid-spring, Cape Grim is heading towards the late-summer/autumn trough in concentrations so are currently recording daily values of around 396 ppm. We expect Cape Grim to reach the 400 ppm milestone for the first time during 2016, most likely around the middle of the year.

CSIRO
Why are southern hemisphere carbon dioxide levels lower?
Carbon dioxide is currently rising at just over 2 ppm each year.
The annual mean carbon dioxide level at Mauna Loa is expected to exceed 400 ppm in 2015, with Cape Grim expected to exceed 400 ppm in mid-2016 and stay above 400 ppm thereafter, although if the current growth rate of 2 ppm per year accelerates then Cape Grim may reach this milestone earlier.
Cape Grim baseline CO2 measurements in Feb 2015 averaged almost 396 ppm for the month.
There is a clear difference between levels of carbon dioxide measured in the Southern and Northern hemispheres, because industrial and other population-based sources of carbon dioxide emissions are concentrated in the Northern Hemisphere.
From measurement to action
Carbon dioxide is one of the primary greenhouse gases. Others include methane, nitrous oxide and synthetic gases, predominantly refrigerants.
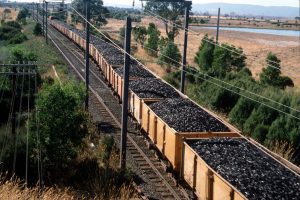
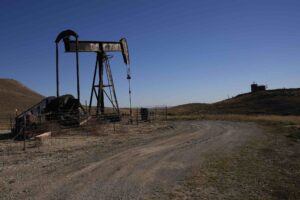
Carbon dioxide levels in the atmosphere are rising mainly because of the burning of fossil fuels and deforestation.
Increasing greenhouse gases in the atmosphere leads to climate change. The amount of warming produced by a given rise in greenhouse gas concentrations depends on feedback processes in the climate system, such as the water vapour response. This both amplifies, by water vapour, and dampens, by cloud formation, the temperature increase due to these long-lived greenhouse gases.
Over half of the carbon dioxide input to the atmosphere is absorbed by natural sinks in the land plants and oceans.
Land and ocean carbon dioxide sinks respectively removed 30% and 24% of all anthropogenic carbon dioxide emissions over the period 2000-2008. This constitutes a massive natural ecosystem service helping to mitigate humanity’s emissions.
To have a 50:50 chance of keeping human-induced average global warming below 2C, it will be necessary to stop almost all carbon dioxide emissions before cumulative emissions reach one trillion tonnes of carbon.
The world has already emitted more than half of this quota since the industrial revolution. At current accelerating growth rates for the combustion of fossil fuels, the rest will be emitted by the middle of this century.
Cape Grim measurements of carbon dioxide are publicly available at http://www.csiro.au/greenhouse-gases/.
Source: The Conversation. Reproduced with permission.