Annual NEM generation for the year ending February 2014 continued to fall, as it has been doing for well over three years. However, for the first time in exactly two years, associated emissions increased, though only slightly (Figure 1). The reasons for this change can be discerned in Figure 2. Hydro generation decreased quite significantly (by 1.4%) and gas generation showed a smaller decrease, while brown coal generation increased slightly, black coal generation stayed almost constant, and wind generation increased slightly, all compared with the year ending January 2014. Two aspects of these changes suggest that they could be a harbinger of the next stage in the evolution of NEM generation.

Firstly, the fall in hydro output was entirely caused by a dramatic reduction of Snowy output, which in February recorded its lowest monthly output for almost three years. February also saw combined average market prices in the NSW and Victorian regions fall to their lowest level since the introduction of the carbon price and Snowy storage levels fall to their lowest levels since late 2011. By reducing output at this time, Snowy Hydro will be able to increase generation in June and July, months when average wholesale prices are consistently higher and also quite possibly the last months before removal of the carbon price. By contrast, Hydro Tasmania continued to generate at high levels. Hydro electricity was exported to Victoria for some hours at maximum BassLink capacity on most days during February. Total energy stored at the beginning of March stood at 37% of maximum capacity — well below the recent maximum of 61%, reached in October 2012, but also well above the lowest level of 19%, reached at the end of the drought in May 2008. In the absence of significantly above average rainfall in SE Australia, a trend of easing hydro output seems likely apart from a last hurrah in winter.
Secondly, the stagnation of gas generation levels is almost certainly the precursor of an imminent decline. The impact of much higher wholesale gas prices, caused by demand from the three LNG plants under construction in Queensland, has been widely reported. Specific manifestations include the decision of the Queensland government owned Stanwell Corporation to suspend operation of its Swanbank E combined cycle plant and sell its contracted gas to a third party; and the decision of Origin Energy to operate its Darling Downs combined cycle plant in open cycle peaking mode only. Less widely reported has been the impact of the
government’s termination, with effect from 31 December 2013, of the state government’s mandatory gas generation scheme, which was introduced by the Labor government in mid‐2005. Over the life of the scheme, annual gas generation in Queensland increased from 7% of total state electricity supply in 2005‐06 to 19% in calendar year 2013, when Queensland was the source of over 42% of gas generation in the NEM, much more than any other state. The Darling Downs and Condamine combined cycle plants were commissioned, as well as several open cycle peaking plants. The combined cycle plants, owned respectively by Origin Energy and British Gas (BG) must now be at risk of becoming stranded assets, substantially offset by the fact that both companies have major stakes in the new LNG plants. The main beneficiaries will be the two state government owned coal fired generation businesses.

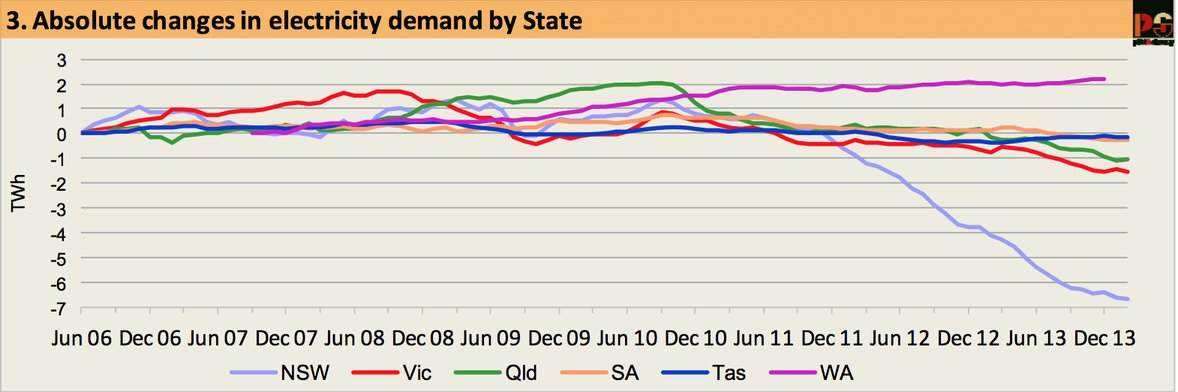
The overall trend for the immediate future will of course also depend on demand. Figure 3 shows no obvious change in the continuous declining trend of the past three years. Later this year, the closure of Point Henry aluminium smelter will remove roughly 3 TWh of annual demand from Victoria, meaning that total demand in Victoria will follow the trend seen in NSW during 2012 and 2013.
Given these trends, the outlook for the immediate future is for less hydro and gas, and a higher share for coal fired generation in the total supply mix. Wind generation will also increase for a while as, according to AEMO’s 2013 Statement of Opportunities, there is 786 MW of new wind generation capacity committed to be built in the NEM (mostly in fact at an advanced stage of construction) to add to the 2,743 MW already operating. Assuming an average capacity factor of 35%, this new generation will supply about 2.4 TWh annually. Point Henry closure and new wind generation will thus reduce annual demand for all other generation by between 5 and 6 TWh. Total generation by Swanbank E, Darling Downs and Condamine power stations in 2013 was 5.2 TWh. Putting all these numbers together, it is possible that the decline in coal fired generation, and consequently greenhouse gas emissions from electricity generation, may slow or even begin to reverse over the next year, though that will be very dependent on whether demand from residential and other business electricity consumers continues to fall.
In the slightly longer term, the outlook for coal fired generation, and hence emissions, will depend heavily on what changes, if any, are made to the RET legislation, following the current review. If the RET is cut back, coal will benefit.
On the subject of household electricity spending, the comprehensive residential consumption data, recently published by the ABS ABS Cat. No. 4670.0) showed national, per customer demand for network supplied electricity fell by 11.2% over the two years from 2009‐10 to 2011‐12. According to reports by the Australian Energy Market Commission, the weighted average price per kWh rose by 33.6% in nominal terms over the same period, equivalent to 27.3% in real (inflation corrected) terms. However, because of the reduction in demand, the real increase in the total annual expenditure on electricity, per household, was only 13.1%, or 6.3% p.a. The total average annual cost of electricity in 2011‐12, in dollars of the day, was $1,460. The increase in this cost over the two years was $230 in dollars of the day, equal to $160 in real terms. Comprehensive consumption data are not available for 2012‐13, but indications are that the decrease of the preceding two years continued. Under an equal drop in demand the overall average national effect of the price increases following the introduction of the carbon price would have been to increase average annual household electricity bills by $74 or 5.1% in real terms.
Source: Cedex. Reproduced with permission.