Looking at the state of the climate, you can see heat everywhere. From the top of the globe to the depths of the oceans and everywhere in between, the climate is warming and changing in ways humans have never experienced.
Last year was between the globe’s third- and sixth-warmest year on record, including record heat in Australia. The frequency of hot days in 2013 was also among the top 10 years while cold nights were among the bottom 10 years. And heat content in the upper ocean reached record highs as did sea levels.

Those changes and more are chronicled in a new report published on Thursday in the Bulletin of the American Meteorological Society. This is the 24th straight year of the report, which amounts to a global health checkup. Except in this case, instead of one doctor doing the exam, it was 425 scientists from 57 countries around the globe contributing to the nearly 260-page report.
It’s a massive undertaking to synthesize global climate data, which is why the report takes so long to put together and release.
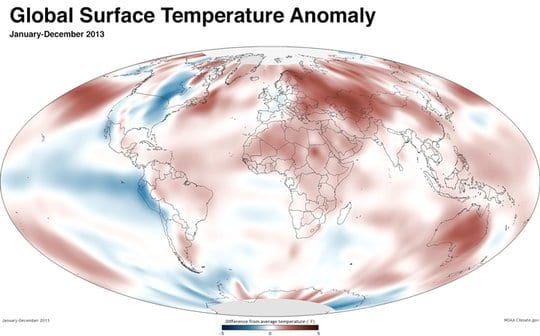
The global average temperature, which is a broad baseline used to measure the climate, was about 0.4°F above average according to four datasets most commonly used by scientists. That was high enough to rank 2013 as up to the third-warmest year since 1880. All 10 of the warmest years have come since, with 2010 topping the charts.“The take-home message here is that the planet — its state of the climate — is changing more rapidly in today’s world than at any time in modern civilization,” said Tom Karl, director of NOAA’s National Climatic Data Center, in a call with reporters.
Global hot spots for 2013 included parts of Russia and Eastern Europe, as well as Australia and Northern Africa. One of the only land areas with cooler-than-normal temperatures was the eastern half of North America.
The frequency of hot days is another indicator of the world’s continued warm streak. Last year was also in top 10 territory, driven in part by the extremes in Australia and Europe. In contrast, cool nights were in shorter supply, with 2013 ranking in the bottom 10 years.

Ocean surface temperatures in 2013 were also among the top 10 warmest. But more notable is the amount of heat stashed in the upper half mile of the ocean, which has increased steadily and reached a record high in 2013.
“Warming in the upper (up to 700 meters) oceans accounts for about 63 percent of the total increase in energy storage in the climate system from 1971 to 2010,” the report said.
Scientists have posited that the apparent “pause” in global warming is being driven by increased heat storage in this layer of the ocean. Ocean warming coupled with melting ice has contributed to sea level rise, which also reached record highs in 2013.
Arctic sea ice extent, glaciers and late spring snow cover all felt the heat last year as well. Each continued a trend in line with the impacts of climate change.
The other notable record, and one which connects the dots between a number of the trends outlined in the report, is atmospheric carbon dioxide. Levels of CO2 and other greenhouse gases that are helping drive climate change were at record highs in 2013. CO2 crossed a notable milestone, hitting 400 parts per million for the first time in human history. Of course, 2014 is on track to smash the records set in 2013, with CO2 levels spending 3 months above the 400 ppm threshold.
Beyond global trends, the year was marked by regional extremes. Australia had its hottest year on record and parts of China experienced record summer warmth. However, the biggest single weather event of the year was Super Typhoon Haiyan, which killed more than 6,000 and left 2 million homeless.
At its peak, sustained winds from the storm reached 196 mph, which is 15 mph faster than the previous record according to James Renwick, a climate scientist at the New Zealand Climate Change Center (Renwick also edited one of the chapters of the new report). Haiyan’s storm surge did most of the damage. Scientists are still assessing just how high it rose but estimates put it in the range of 24 feet.
While the connection between the rapid intensification and strength of Haiyan with climate change is still being studied, sea level rise represents a more direct climate change link. The Philippines have seen as much as 7 inches of sea level rise since 1970. To put that in perspective, the planet as a whole has seen 8 inches of sea level rise since 1900.
“Sea level rise is much higher than the global average in this part of the world, so the sea’s are already a little higher. If you put a storm surge on top of higher sea level, it amounts to a greater extent of coastal inundation.” Renwick said.
With 2014 halfway over, there are no signs that the globe’s hot streak is ending. Data through May shows that this has been the planet’s fifth-warmest start to the year on record. Jessica Blunden, a scientist who works with NCDC, said that preliminary data show that June’s ocean temperatures were the hottest on record, a sign that 2014 is on track to be one of the hottest years recorded. Another factor tipping the scales in that direction is the impending El Niño, a climate phenomenon that usually boosts global temperatures. Other indicators like greenhouse gas emissions, Arctic sea ice and deep ocean heat are also likely to keep following suit.
Source: Climate Central. Reproduced with permission.