Australia reaches 4GW of rooftop solar PV

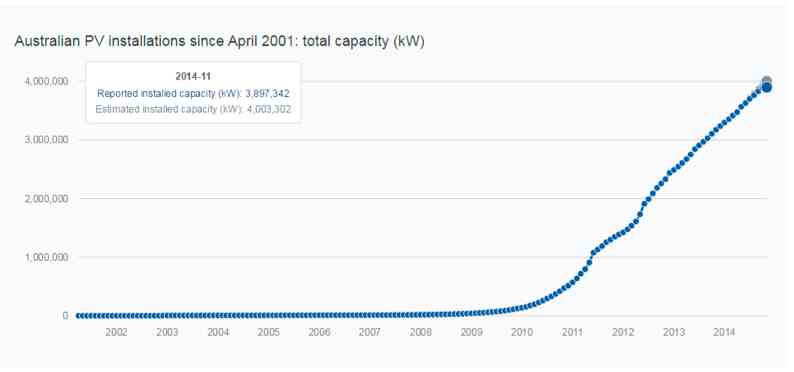
Australia has surpassed 4GW of rooftop solar PV, according to data provided by the Australian Photovoltaic Institute. The revelation comes just days after Australian Bureau of Statistics data indicated that one if five houses around the country had a rooftop solar array.

The APVI, which operates the solar map that tracks capacity, output and generation share across Australia, said the breaching of the 4GW mark means that rooftop solar capacity has risen four-fold since 2011. It estimates that more than 40 per cent of households in Queensland and South Australia have solar panels.

apvi solar 4GW


According to separate data from Green Energy Trading and network operators, more than 15,000 households in Australia are adding solar each month, meaning that at least 600MW has been installed in the first 10 months of the current year.

APVI said its estimates of current installation comes through its live ‘solar map’.  It is hosting the Asia Pacific Solar conference on Monday through Wednesday, where more than 280 solar experts will gather in an event co-hosted by the NSW government and the Australian Renewable Energy Agency.

Comments

18 responses to “Australia reaches 4GW of rooftop solar PV”

  1. Chris Drongers Avatar
    Chris Drongers

    Ok, that is over 2.11 % of Australian electricity consumption (2012-13 electricity consumption http://www.bree.gov.au/files/files//publications/aes/2014-australian-energy-statistics.pdf)

    As residential energy consumption (combined all fuels) in Australia is about 7% of the total (1/14th of the national use) solar is currently producing about 28% of total residential energy consumption in Australia.

    Commercial (offices) use of energy is about 5% of total energy use (1/20th of the total) so solar is producing nearly half the energy used in offices and shops.

    As electricity increases its share of residential energy use (reverse cycle air conditioners replacing gas heaters, induction cooktops replacing gas, reduced water use (desalination and pumping reduced) solar will increase its share.

    How fast can the electricity incumbent generators and retailers realign their business models to accomodate this?

    1. nakedChimp Avatar
      nakedChimp

      the QLD bunny moved on that one.. going to be leased now, no more selling – makes them ‘look good’ for the rednecks, as the state is keeping it’s assets.. 😉

  2. GlennM Avatar
    GlennM

    Fantastic,
    I never thought as a Kiwi I would be cheering the average “Aussie battler” for doing something the politicians refuse to

    Cheers

  3. Marcelo Avatar
    Marcelo

    What happened in 2010 to create the rapid take up? The looming price on carbon?

    1. ConnorJ Avatar
      ConnorJ

      The solar feed-in tariffs and small-scale RECs

    2. Professor Ray Wills Avatar
      Professor Ray Wills

      Perfect storm – fitted sex, yes.

      Sorry, spell checker.

      FiTs and sRECs, yes.

      But add strong aussie dollar, combine with a glut of solar from China following stalled European solar policies post GFC and solar becomes as cheap as.

      If Aussie falls much further – and it probably will – may soon have a sting on solar.

  4. Daylight Times Avatar
    Daylight Times

    Solar is no longer the David it once was. It’s now an ever-growing Goliath. The politicians need to accept this, and that’s even right here in North QLD.

  5. michael Avatar
    michael

    A good news story for Australia on the carbon front. perhaps Bishop should lecture China on lifting their rooftop solar penetration to levels similar to Australia? This is a good news story for the government in the face of increasing criticism on the climate front

  6. Rob G Avatar
    Rob G

    To put that number into perspective 4 GW is equal to 4-8 coal fire power stations (average being between 500MW – 1GW). And we know Queensland coal fire is hurting most of all.

    1. Andrew Woodroffe Avatar
      Andrew Woodroffe

      Sorry but no, it is not equivalent. By energy, 200MW of coal is equivalent to around 900MW of PV (assuming coal generation has a capacity factor of 80%), by capacity during peak loads (which are shifting into the evening due to all the solar) just over 700MW (IMO estimates 28% of max rating). So, by installing enough solar to replace coal in terms of actual generation, you end up with more than enough power to cope with peak loads.

      Not only should we close down old coal, now, we can. And without the requirement to install any new gas plant. In fact, they need to get ready to be stranded, too. Note that these are WA numbers, I would expect Queensland figures to be a bit smaller.

      1. Rob G Avatar
        Rob G

        Well I do agree we should shut down coal now. I’m not sure I understand how 200MW of coal can equal 900MW solar? Care to explain further? And should solar have storage attached does your equation change? As I see it the amount of energy obtained from coal is actually quite low 20% thereabouts. Much like oil where more is lost in the burning of it.

        We know that QLD already has over 1GW of rooftop solar, which in modest terms (by coal’s own admission) is taking about 10% away from the coal-fire plants (be it at peak times).

        1. WR Avatar
          WR

          A coal-fired power station produces about 5 times as much energy as rooftop solar for a given power rating.

          For example, an operational 200 MW coal plant can produce 200 MW of power for 24 hours a day. About 5% of this is used to run the power station. In Australia, another 10% or so is lost in transmission. The various turbines will also be shut down once in a while for maintenance, etc. So overall, it will deliver 80-85% of its energy to consumers. Let’s call it 83%. This would be its capacity factor. So in a 24 hour day, the 200 MW station would deliver 200 x 0.83 x 24 = 3984 MWh = 3.984 GWh of electrical energy to consumers.

          For rooftop solar in Australia, each 1 kW of capacity will deliver about 4 kWh of 240 V AC energy per day averaged across the year. (This takes into account losses in the inverter.)This gives a capacity factor of about one-sixth, or 16-17%.

          So 1 GW of installed rooftop solar capacity will deliver about 4 GWh of energy to consumers. This is approximately the same amount of energy that the 200 MW coal-fired station delivered.

          The capacity factor of wind generators in Australia is about 32%, without taking into account transmission losses.

          1. Chris Drongers Avatar
            Chris Drongers

            but then, what is the annual overall capacity factor (not availability) of all Australia’s coal fired plants combined?

            Remember that coal plants are not all needed all the time so they are cycled in and out as power demand goes up and down.

          2. Ronald Brakels Avatar
            Ronald Brakels

            Brown coal’s capacity factor is about 80%, black coal’s is about 40%. This is very approximate only and black coal’s capacity has probably increased now the carbon price is zero and gas prices are up.

          3. Andrew Woodroffe Avatar
            Andrew Woodroffe

            Coal plant, like nuclear, involves big chunky bits of steel and concrete which do not like thermal expansion or contraction so ramping up and down is not what they do well. Small gas turbine peakers are designed for load following. Of course, during rare moments of high wind penetration, wind can be curtailed (and WA it is, cheers Collgar) and do this quicker, mpore accurately and cheaper than anything else.

          4. Andrew Woodroffe Avatar
            Andrew Woodroffe

            Thanks Rob, I was not even going to bother about line losses – where I wrote coal, perhaps I should have said coal plant, likewise for solar.

          5. WR Avatar
            WR

            The calculations I gave in my earlier post refer to the potential capacity factor of coal-fired power. As others have stated, electricity demand might mean that the generator is not operating at its capacity.

            The following website shows that the average capacity factor of fossil generators on the NEM is about 60%. After taking into account transmission losses, this would fall to about 55%. You can use the website to check the capacity factors of individual power stations.

            http://energy.anero.id.au/fossil-energy

          6. Rob G Avatar
            Rob G

            Thanks WR. I wonder how the CVP with thermal salt storage compares to coal. Those salt towers can hold incredible high temperature molten salt and it stays very hot for many days even when followed by cloudy days. Any idea on their capacity %?

Get up to 3 quotes from pre-vetted solar (and battery) installers.