This Cedex Update contains NEM data for the whole of financial year 2012-13, which is the first full year of carbon pricing. As Figure 1 shows, the now longstanding trend of decreasing generation and emissions continued in June. For the whole year, generation was down by 4.3TWh, equivalent to 2.2 per cent, and emissions were down by 12.2 million tonnes CO2-e, equivalent to 6.9 per cent.
Comparisons with the three preceding years are as follows: 2008-9 to 2009-10 generation + 0.7TWh emissions – 5.8Mt CO2-e 2009-10 to 2010-11 generation – 1.9TWh emissions – 7.4 Mt CO2-e 2010-11 to 2011-12 generation – 3.8TWh emissions – 1.2Mt CO2-e 2011-12 to 2012-13 generation – 4.3TWh emissions -12.2Mt CO2-e
These numbers crystallise the complex relationship between generation and emissions seen in Figure 1, which, as previous Cedex Updates have explained, reflects the continually changing interaction between the LRET, the factors driving reduced demand, and the carbon price. All are important contributors to the good news story of steadily falling Australian electricity generation emissions. Given the complexity of the interactions, it would be rash to assume that the acceleration in the downward trend as experienced over the last year would continue if any one of these drivers were removed.

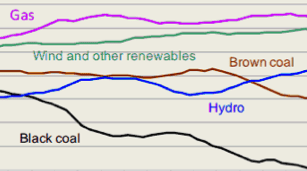
For the month of June, annualised electricity supplied by black coal generators continued to fall, while generation from brown coal generators recorded a very small increase. In total, black coal generation fell by 4.7TWh during the year, while brown coal generation fell by 5.5TWh. However, during the preceding five years black coal generation had already fallen by nearly 19TWh, equivalent to over 15 per cent, whereas brown coal generation had actually increased slightly.
Output from gas and wind generation both fell slightly during 2012-13, while hydro generation increased, as it has been doing consistently since the beginning of calendar year 2012. Coal fired generators supplied 72.5 per cent of NEM generation.

The full percentages for the year 2012-13 are:
– Total coal 72.5%
– Gas 12.2%
– Hydro and other renewables 15.3%
This issue of Cedex Electricity Update includes WA demand data for the first time, as can be seen in Figures 3 and 4. The Independent Market Operator (IMOWA) reports total demand on a sent out basis. This means that it reports electricity sent out from power stations, excluding the substantial quantities of electricity consumed at the power stations themselves, termed auxiliary load (and sometimes called parasitic load). Coal-fired power stations have much higher auxiliary loads than gas-fired power stations, with brown coal, on average, higher than black. Auxiliary load at hydro and wind power stations is effectively zero.
By contrast with WA, demand, as defined in the NEM, includes auxiliary loads; it also includes electricity generated by coal-fired power stations during off-peak (overnight) periods to pump water to upper storages at the pumped storage facilities in NSW and Queensland. Adjusting for these factors effectively converts quantities of electricity generated at power stations to quantities of electricity sent out from power stations. These adjustments for pumped storage and auxiliary loads have been applied to total state demand in the NEM, as reported by AEMO, to convert demand as generated to demand as sent out, thereby making the WA and the NEM figures, shown in Figures 3 and 4, directly comparable.
Interestingly, these adjustments have removed about one fifth of the total fall in NEM demand over the year, as reported by AEMO, because lower coal-fired generation has reduced auxiliary load. It can be seen that, notwithstanding the very strong economic and population growth experienced in WA over the last few years, demand for electricity in the SWIS (which does not cover the areas where new LNG plants and iron ore mines are being constructed) has not grown since 2011. Note that whole of month data published by the IMOWA is delayed by several months, so we do not know whether the beginning of a decline in demand, apparent in the data to the end of February 2013, is continuing, as it is in all the NEM states except Tasmania.

All Data analysis, text and graphs: Hugh Saddler
Hugh Saddler is the Principal Consultant, Energy Strategies at pitt&sherry