Rooftop solar. Photo: Giles Parkinson.
Virtually all of the political focus on residential electricity is around prices, the cost for a kilowatt hour (kWh) of electricity when purchased from your favourite retailer. Really though, it’s the total amount paid that matters, so volume is a driver as well as price.
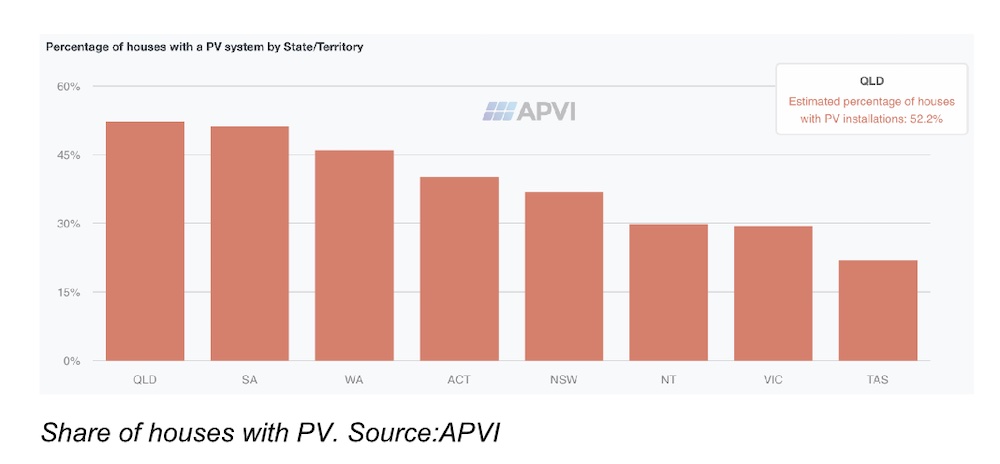
When we look across total households in the NEM, it’s really the impacts of rooftop solar that dominate the changes. In Queensland, more than 50% of households have rooftop solar. Over 50%. Nationally, I think the number is about 40%.
The number of households with solar grows by about 300,000 a year at the moment and for every one of those households their electricity bill is permanently reduced, obviously at the cost of some capex.
So if I could add up the electricity bills of all households, and ignored the capex, my suspicion is that total household electricity costs haven’t changed much despite what’s happened in the spot market. As a counter, AGL’s grown its consumer electricity sales (a bigger segment than household) by about 25% between FY19 and FY24.
In any case, looking across the national electricity market (NEM), spot prices have grown at less than inflation, up about 7% in total since 2018, but that is mainly because spot prices in Victoria have fallen as new capacity has more than fully replaced Hazelwood and because Victoria can’t export its surplus to other states. If it could the price changes from State to State may have been more even.
In New South Wales and Queensland the energy component of retail tariffs has increased sharply in the past couple of years. It fell in the current year and may fall a bit the next year but I think it’s moved to a higher average than before. See discussion below.
Environmental taxes are a very modest component of bills and have barely changed.
Retail margin has not changed much.
That leaves what’s happening to wires and poles. There is plenty going on beneath the surface. Technically consumers don’t see transmission costs. They are included in the network bill. Historically, and probably looking forward, transmission has been only a modest cost in the overall bill. For many years we built little or no transmission in the NEM.
That is changing. We are building heaps of transmission, from clearly needed but expensive projects to better link Tasmania, Victoria, Queensland and NSW and intrastate to connect up the new REZs through to more marginal and still expensive projects like Copperstring. So that component of bills will rise, possibly doubling if I did the sums.
Although rooftop solar acts to depress prices in the spot market it also acts to depress volumes through the distribution network, and since the network is entitled to what is essentially a fixed revenue stream, lower volumes result in higher prices.
It is I think fair to observe that households without solar are exposed to the increase in network costs without any of the benefit of reduced volumes. They might get some of that back because its households with solar that push down spot prices, but the sums are complicated and the one effect is much more visible than the other.
What is likely is that without an increase in (throughput /asset base) network prices will continue to increase. For many years I have been tempted by the idea that, like some water rates, most of the distribution cost of electricity should be fixed and tied to the rateable value of the property. Even better it would be a one time cost built into the cost of the property when constructed.
That reflects the underlying fact that the vast majority of the costs of wires and poles to the household sector is almost totally fixed. However, such thought bubbles will ever remain thus and the reality is that wires and poles share of the retailer tariff quote may well increase over the next few years.
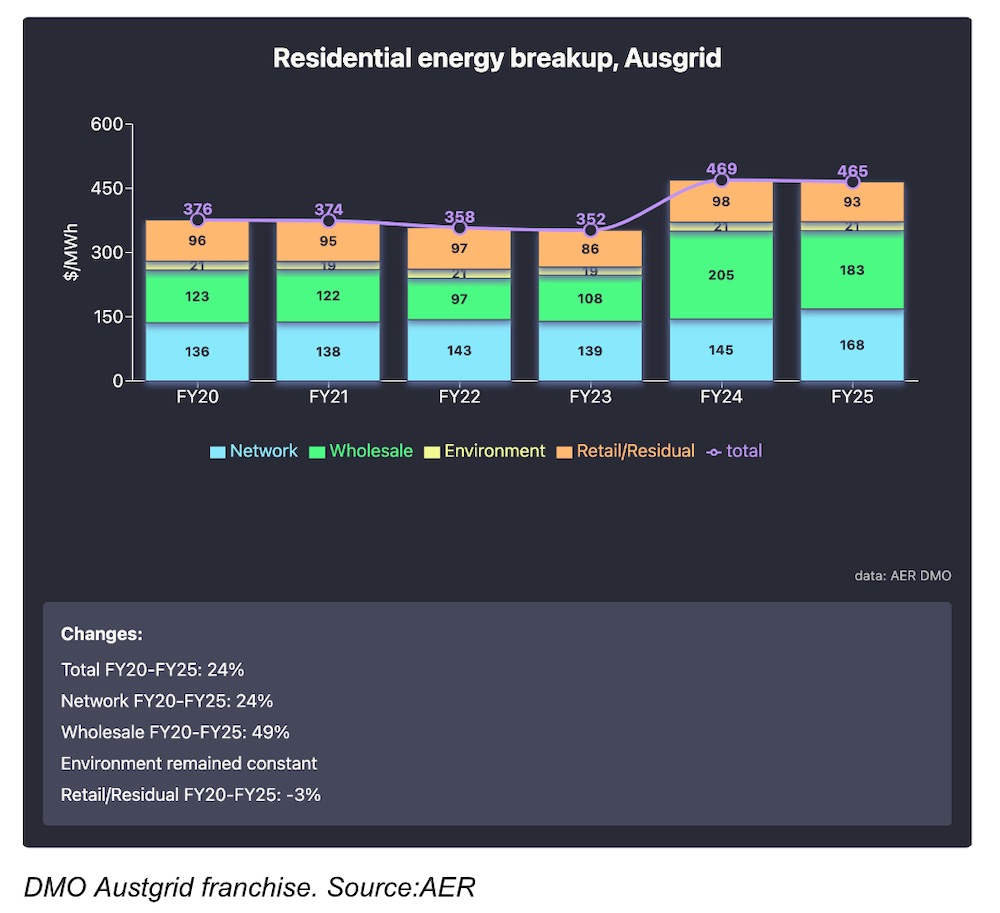
In another of these pieces I basically dislike writing, it’s time to delve into the murky world of retail bills. The almost universal perception is to look at prices. I’ve used the AER’s default market offer (DMO) throughout this piece.
The changes from 2020 are clear, a nearly 50% increase in wholesale prices and a steady 24% increase in network prices. Wholesale prices fell significantly in FY25 from FY24, but due to a big increase in network the total price didn’t really move.
Overall there is a compound growth rate of 4.3%. During the same period the CPI increased at 4% per year
There are a whole bunch of things to unpack in this chart. However, the two main points are:
Wholesale or energy prices lag what is actually happening in the spot market. Retailers hedge their purchases forward. They buy say 25% of volume three years forward, 25% two years forward, 25% 1 year forward and 25% at spot. Of course it’s way, way more subtle than that, positions are constantly being adjusted, but basically some portion of the retailers energy cost in the current year FY25 represents electricity purchases from one and two years ago.
The residential price is thus backwards looking, not forwards looking. It’s a trailing average not a forward average. So to understand what next year’s price will be you have to look back at spot prices one or two years ago.
And I draw attention to the decline in prices between 2019 and 2021 the period when the default market offer (DMO) got going and the subsequent and unprecedented rise in prices associated with the tyrant Putin invading Ukraine and simultaneous flood related slow down of thermal coal production. Spot prices averaged $250/MWh for 6 months, more than 3X the current level. Retailers did badly in those financial years and now they are recovering their losses.
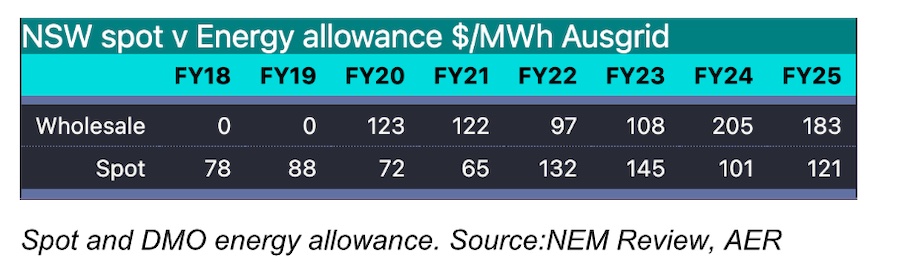
If I compare NSW spot prices with the energy allowance used by the AER for the Ausgrid franchise DMO you get:
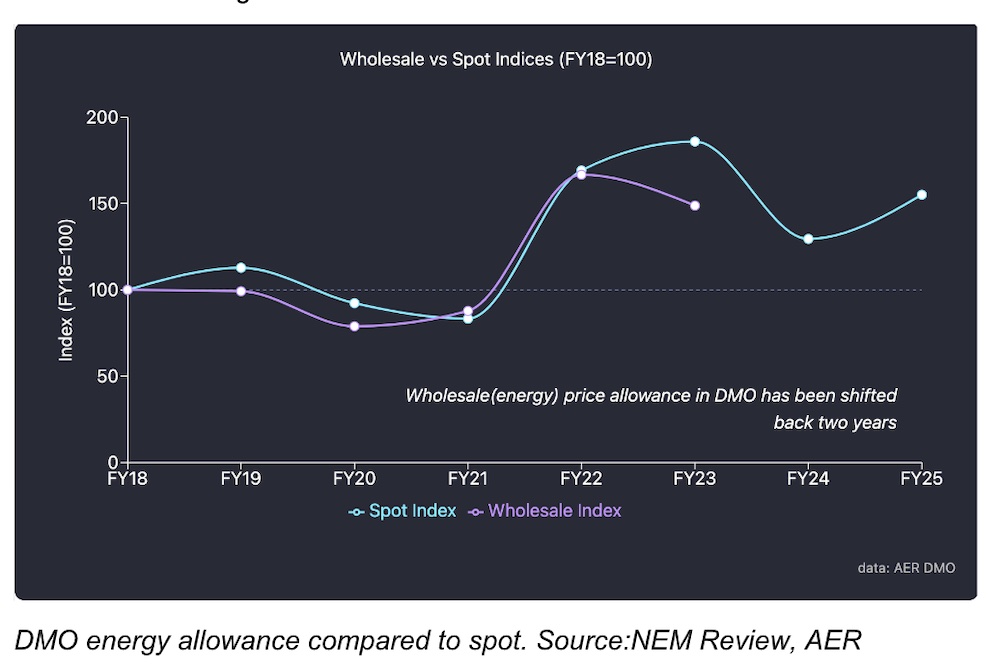
And then if I shift the wholesale allowance in the DMO back two years, and convert both series to an index the resulting plot shows quite a good fit and if you want you can see what might happen to the wholesale price allowance, and by implication to the wholesale component of most retail tariffs over the next couple of years. Still I wouldn’t read too much into the chart. Doing this stuff almost makes me wistful for the years in investment banking research.
More broadly, wholesale prices on average across the NEM have grown about 1% per year since 2018, much less than inflation.
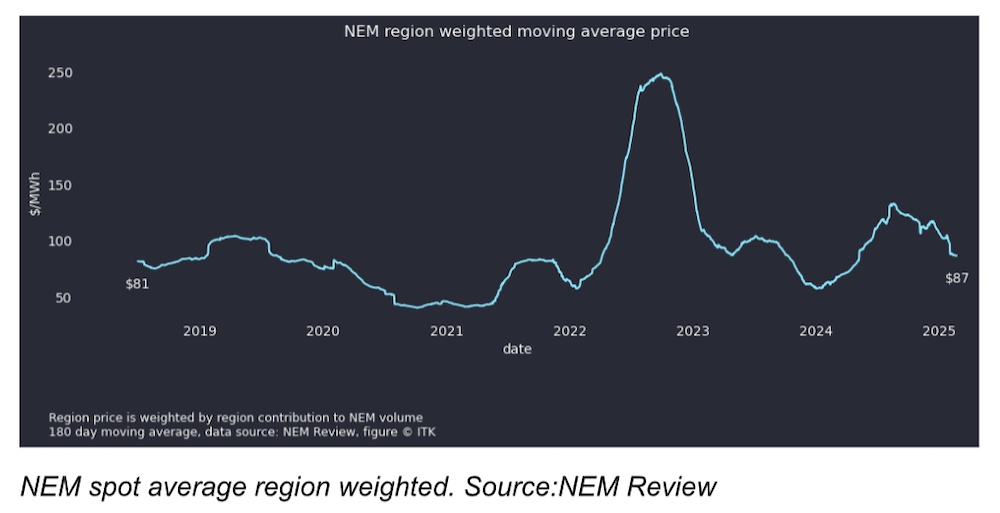
The following figure gives one interpretation of NEM wide spot price movements.
Since 2018 on this calculation spot prices across the entire NEM are on average up 7% from $81/MWh to $87 presently. The figure is price in each region for a given half hour multiplied by that region’s share of production in that half hour and then a moving average over six months. Even though prices in NSW and QLD have increased prices in Victoria have fallen and so when you do the weighted average you get a modest net increase.
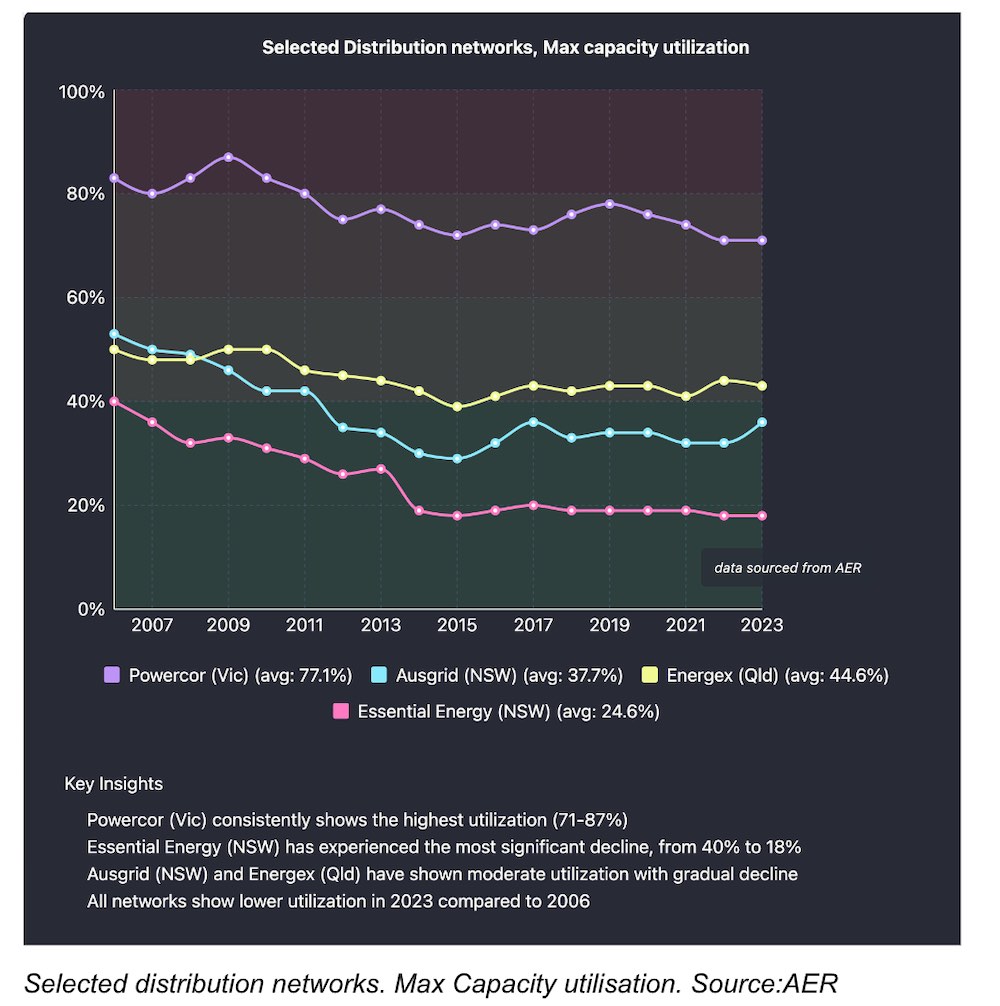
Network capacity utilisation has been falling and is now stabilised to an extent, but as revenue or actually return on capital must be maintained if volumes fall prices rise to compensate. The following figure is from the AER’s annual electricity market review.
Note that this interesting figure is uses annual peak demand. The network has to have capacity for peak demand but if average demand was used I suspect the data might show a bigger fall and would definitionally show lower average numbers.
In general, the data clearly shows plenty of network capacity. Of course there are hot spots and some networks see growth but generally if networks were paid on volumes and not invested capital they’d be worth a lot less money. I have to say the halving of Essential Energy’s capacity utilisation stands out.
The network capacity utilisation is likely the impact of rooftop solar. Pretty obvious rooftop solar reduces energy sent through the wires and poles. Rooftop doesn’t necessarily reduce evening demand, but prior to the introduction of solar demand was often high in the middle of the day driven not just by residential but but by business. Now peak demand tends to be in a shorter and shorter duration in the evening. One I expect batteries to intrude on.
The Nework costs as published by the AER lumps distribution and transmission together and is volume dependent. Distribution tariffs actually consist of a fixed daily cost and typically a volume charge. The daily cost when divided by volume is obviously bigger the smaller the volume and the AER uses for Ausgrid 3.9 MWh.
The latest gas market outlook is less of a temporary supply-gap reprieve and more the…
Andrew Forrest says fossil fuels carry volatility, political cost and risks for mums and dads…
Tony Abbott's climate attacks inspired a local community to build a first of its kind…
A solar farm inspired by Tony Abbott's climate attacks has finally been opened. Mhairi Fraser…
Australia's booming and hyper-competitive home battery market has a new number one brand claiming highest…
Fluence is seeing fewer requests for two hour batteries as developers jump on lucrative longer…