Source: Freepik
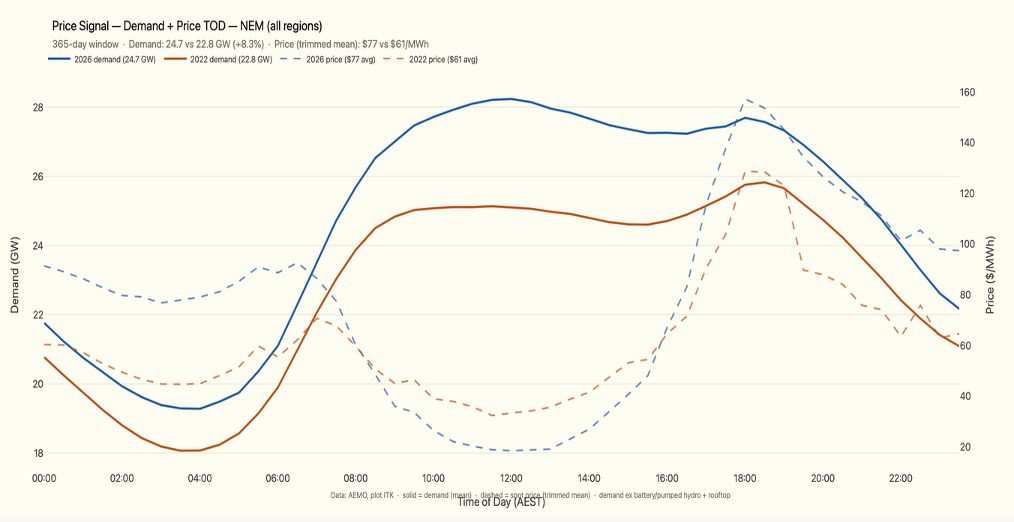
Electricity demand is up 8 per cent on Australia’s main grid – the National Electricity Market (NEM) in the past year compared to 2022 – which is quite a respectable really.
Demand has grown most strongly in the middle of the day, and in Queensland, and it seems there is, or will be, enough battery capacity to significantly impact volumes, with 15 GW of battery power equivalent to more than half of average NEM demand.
However, while batteries are clearly visible in the supply numbers, they are not as prominent as their operating capacity would suggest. That suggests we need not just more batteries, but more independent batteries, more actual competition in the evening peak market.
The following plot shows NEM wide demand for the past year compared to the Feb 2022-23 period on a time-of-day basis and the time-of-day, region-share-of-demand-weighted, NEM-wide spot price for both years.
Figure 1
The takeaways are:
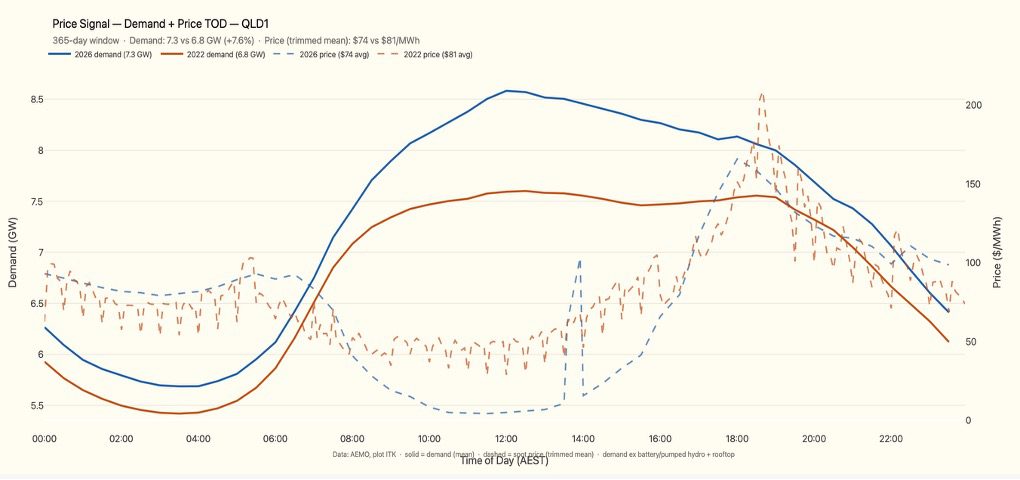
For what it’s worth it’s most obvious in QLD. That’s natural because QLD is most exposed to rising temperatures and has the best solar resource.
Figure 2
The 2022 price plot is saw-toothed because it uses a trimmed mean to avoid spikes.
I received a bunch of pushback on my note saying batteries would impact coal volumes as well as prices. But I reckon the facts are fairly clear even if you need good eyes to observe them right now. I am reminded of the economist who predicted three of the last one recessions.
There will be at least 15 GW of batteries when all that have started construction are operating. As you can see from the first plot that’s enough to meet more than half the NEM demand for 2 hours, actually 2.5 hours.
Plus, there was probably closer to 8 GWh than 7 GWh of cumulative household battery installed capacity. I estimate that’s about 1 GW of power if they all ran at once, though information on inverters is limited. Some of that will be outside the NEM.
Figure 3
More batteries are certain to be developed—in the end they will be needed. Meantime, about half that capacity is nominally installed. But as we know some is not yet commissioned and Waratah has 2/3 of its capacity out of action.
Figure 4
This plot also indicates that the big gentailers remain major players in the market, particularly in NSW with the Liddell and Eraring batteries both of which are to some extent still commissioning. It’s unlikely consumers will see the full benefit of the battery capacity without adequate competition.
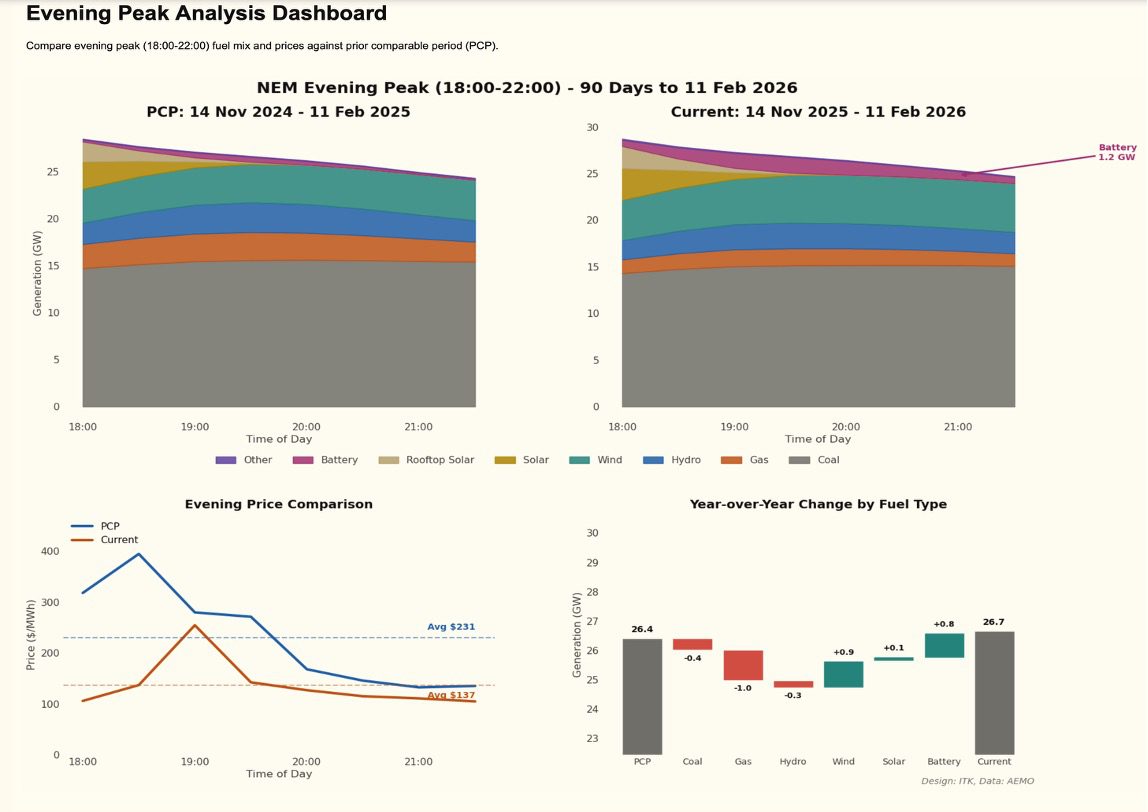
It’s interesting that even though there are notionally 7.5 GW of battery capacity and probably 5 GW in full service battery output is only a fraction of this on average.
This analysis focuses on the evening peak because that is where the market share and spot price competition from batteries will be focussed. So that’s broadly 6 pm to 10 pm in the QLD timezone the NEM uses.
The average output over the past 90 days in the NEM is just 1.2 GW. That’s up on last year but not as much as I might expect. My plot does exclude Kidston.
Figure 5
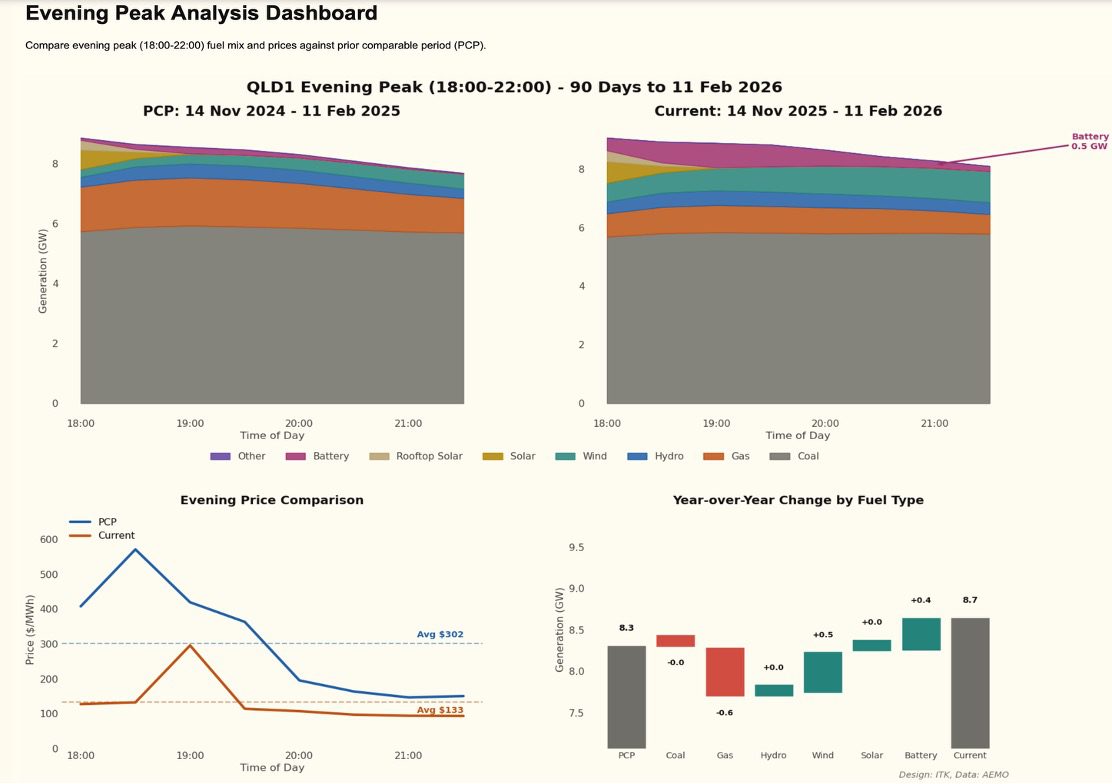
Once again QLD is the state where the most disruption is going on, due to wind as well as batteries, but this is masked by the increase in demand.
Figure 6
It’s good batteries are doing something, because new wind projects remain thin on the ground.
Figure 7
Although once again, and including MacIntyre, QLD has the biggest pipeline. Eventually even MacIntyre will end up being fully commissioned.
The "35 by 35" electrification goal has an Australian origin that the government seems to…
If we fail to ensure data centres pay for new renewables and storage to cover…
Home batteries look like resetting the behaviour of households when it comes to responding to…
South Australia energy minister hints that the 100 pct net renewables target may not be…
Australia's first major transmission loop is now operating, and will be at full capacity by…
Former EDO boss and now Greens MLC Sue Higginson on the huge implications of the…