Source: Freepik
The larger and the more diversified, but particularly the higher the Sharpe Ratio of a renewable portfolio, the lower its overall cost to provide flat load power to the likes of aluminium smelters and data centres;
An ESEM is the ideological opposite of a CIS contract. CIS required wind and solar developers to secure a market-determined PPA from a gentailer. By contrast, an ESEM provides a full return to the wind, solar, or battery developer. Competition comes from bidding to be an ESEM supplier.
Gentailers are, I think, unlikely to compete with the Federal Government, let’s call it the “administrator”, in the market to write PPAs, so the Government will end up with most of the utility-scale renewable energy developed from 2027 onwards.
Because the administrator will have the largest and most diversified portfolio, and if it was clever, it would make it a high Sharpe ratio portfolio, it would actually be the lowest cost supplier of dispatchable flat load power to the large industrials eg data centres and aluminium smelters.
It would be a natural extension of its role to become an industrial Gentailer.
In short, big portfolios are better in renewable energy markets and this pushes the market to consolidate. The Federal Government via the ESEM will essentially accelerate this natural tendency and in turn this pushes the Government to also being essentially a retailer to industry.
Of course, as well as this the behind the meter market will continue to develop apace with EVs filling whatever gaps the home battery scheme has left behind.
Should this scenario come to pass I’m not sure I’d want to be one of the big gentailers. However, as always, analysis of markets is highly prone to error.
ESEM is still a concept rather than a reality, and real-world barriers such as transmission and basis risk obstruct high Sharpe ratio portfolios. Some smart market operator may find an entirely new business model.
Over the years, I’ve read and written several notes about how to power an aluminium smelter, and by extension a data centre with renewable energy.
Generally, when a consultant approaches this task they build a portfolio of wind and solar and firming that can meet say 1 GW of uninterruptible power demand.
I used to do this but now I think the smelter or data centre should just buy from a centralised supplier, or even better and not further considered in this note, just buy totally unhedged from the spot market.
The contracts that Rio Tinto have signed for the repowering of Boyne Island smelter in Gladstone are a typical example. Rio signed a large wind and large solar PPA although neither project has yet commenced construction.
The firming for Boyne Island has not been publicly announced even though it is obvious that there will be many occasions when wind and solar won’t provide the 850 MW that Boyne Island needs.
Similarly Larry Fink, yet another “energy expert,” but actually the CEO of BlackRock, says you can’t run data centres on intermittent energy alone. Apparently you need dispatchable power. Doh. Thanks Larry, excuse the sarcasm, none of us had thought of that before.
The lowest long-term cost occurs when the risk is carried by the person best placed to judge the cost, or where the cost is cheapest.
For instance, insurance companies exist because the lowest average cost is found by pooling individual risks and the insurance company charging a premium. And there is a further point from insurance in that generally the bigger the pool the lower the cost to policy holders.
In one of my own Doh moments the same holds true with investments. Generally finance theory has shown that the more diversified a portfolio is the better the trade-off between risk and return. I’ve written about this before when discussing the theoretical best Sharpe Ratio portfolio for the NEM
To quote from Wikipedia
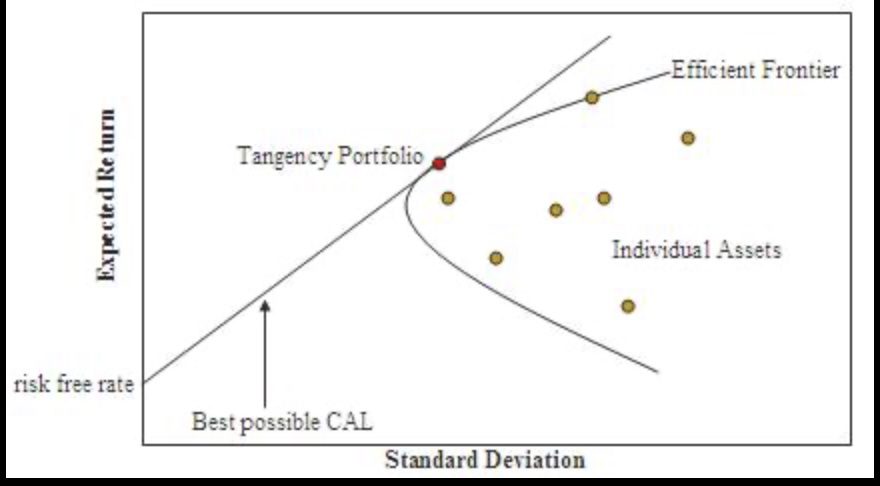
In modern portfolio theory, the efficient frontier (or portfolio frontier) is an investment portfolio which occupies the “efficient” parts of the risk–return spectrum. Formally, it is the set of portfolios which satisfy the condition that no other portfolio exists with a higher expected return but with the same standard deviation of return (i.e., the risk).[1] The efficient frontier was first formulated by Harry Markowitz in 1952;[2] see Markowitz model.
Figure 1: image-20260128101504624
Look at the following figure.
Figure 2: image-20260128120552887
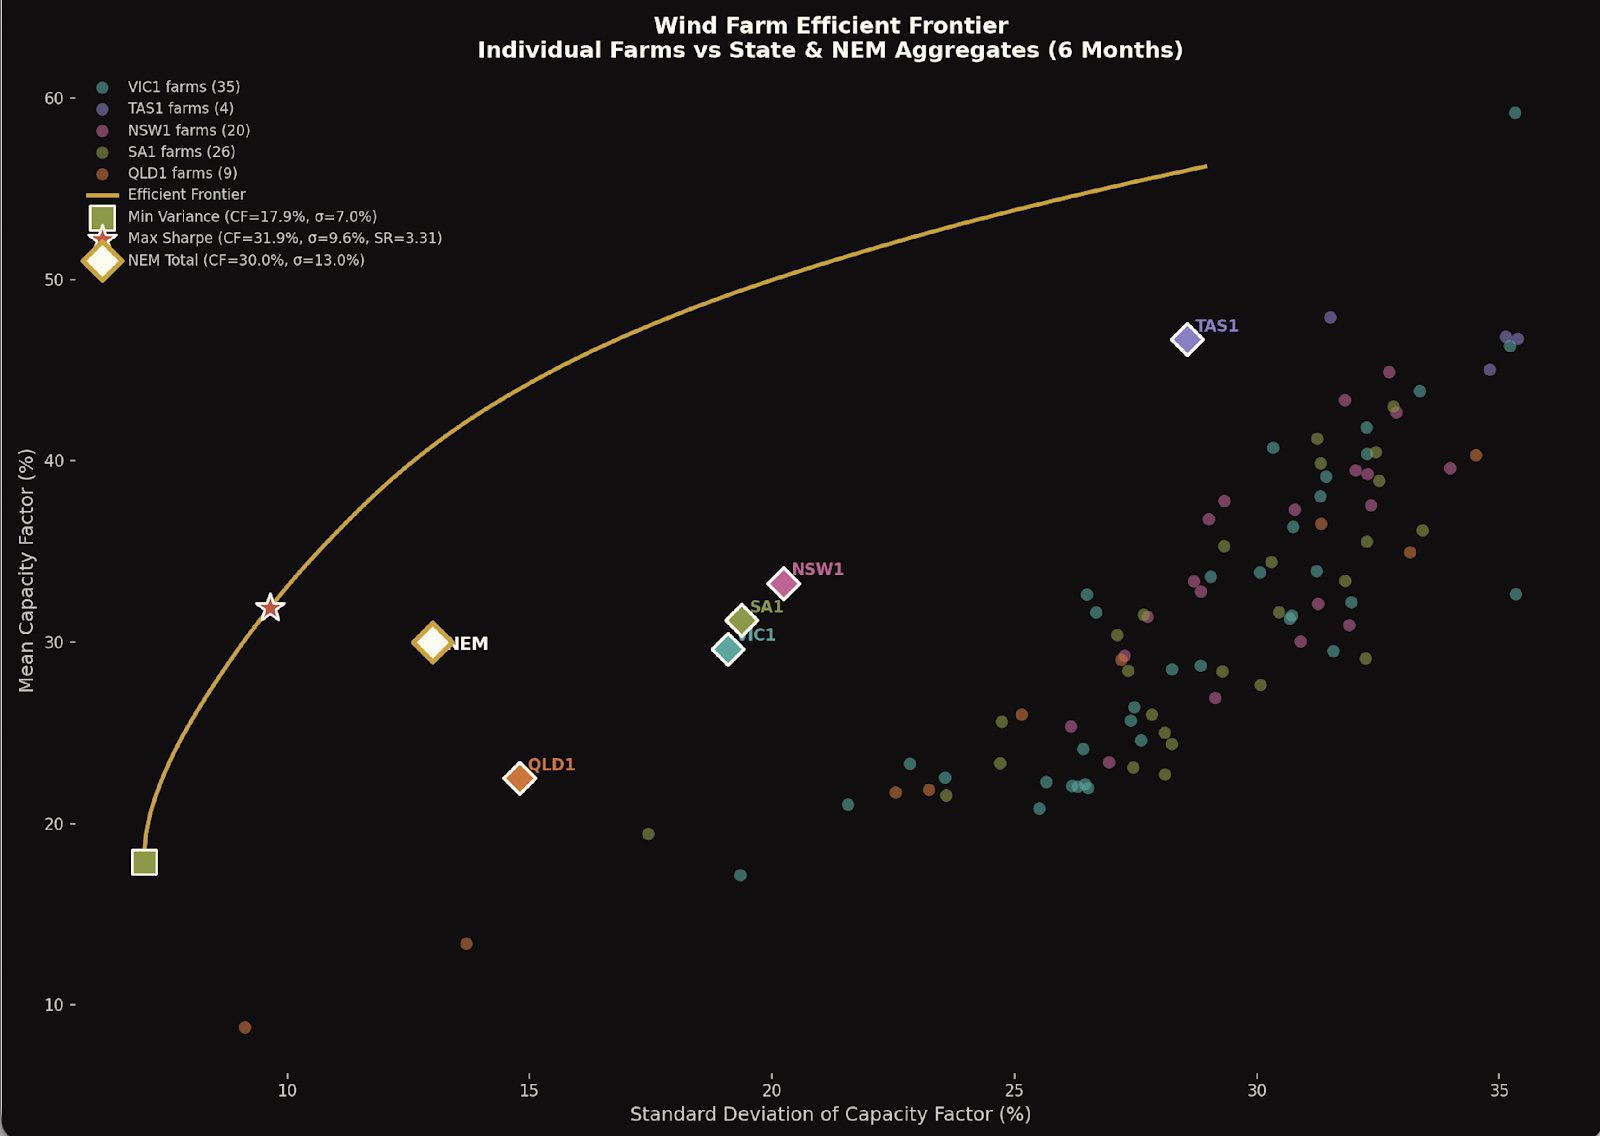
The plot shows the achieved capacity factor plotted against the standard deviation for all 94 wind farms in the NEM.
The red star is the theoretical best weighted portfolio and it reflects the portfolio of wind farms and how much of each wind farm’s capacity that say a data centre or an aluminium smelter would buy if it wanted to minimise its firming cost and didn’t have any solar.
The standard deviation of that portfolio is only 9% which means that 95% of the time the output would be within about 80% of the average.
The diamonds show for each State the capacity factor and standard deviation of all the wind farms in that State aggregated, as well as the NEM portfolio. Again, the plot clearly shows that owning a share of a State-wide wind portfolio is a much better deal than owning any individual farm.
For those interested.
Optimal Portfolio Composition (Max Sharpe)
27 farms across all 5 regions:
| State and NEM portfolios | |||
|---|---|---|---|
| ⏺ Region | Mean CF | Std Dev | Sharpe |
| TAS1 | 0.47 | 0.29 | 1.63 |
| NSW1 | 0.33 | 0.20 | 1.64 |
| SA1 | 0.31 | 0.19 | 1.61 |
| VIC1 | 0.30 | 0.19 | 1.55 |
| QLD1 | 0.23 | 0.15 | 1.52 |
| NEM Total | 0.30 | 0.13 | 2.31 |
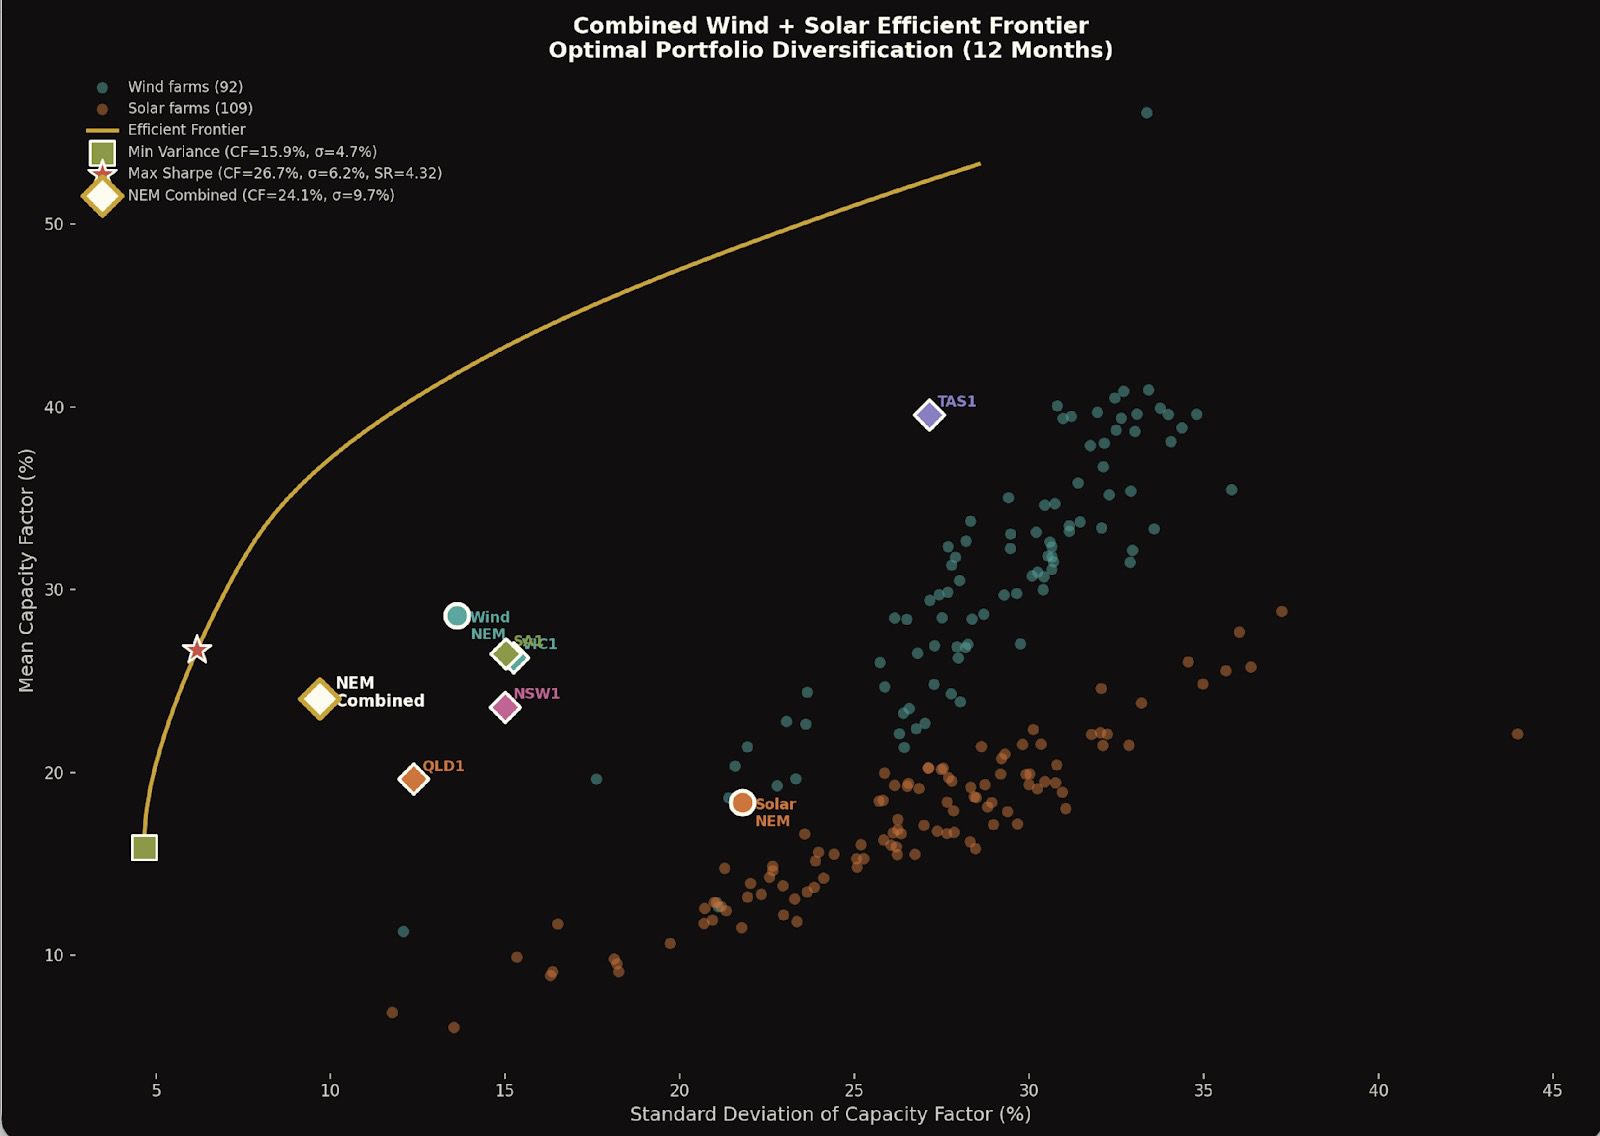
When we add solar into the mix the optimal portfolio Sharpe Ratio increases to 4.3.
However, the most important outcome is that the actual NEM wide portfolio, that is all the currently operating wind and solar farms have a combined output with a relatively good Sharpe ratio, although still 50% more volatile than the best designed portfolio.
Figure 3: wind and solar frontier
So Dave’s rule is: “the higher the portfolio Sharpe ratio, the lower the firming cost” and a corollary is that big diversified portfolios of wind and solar produce lower firmed cost of power than smaller portfolios.
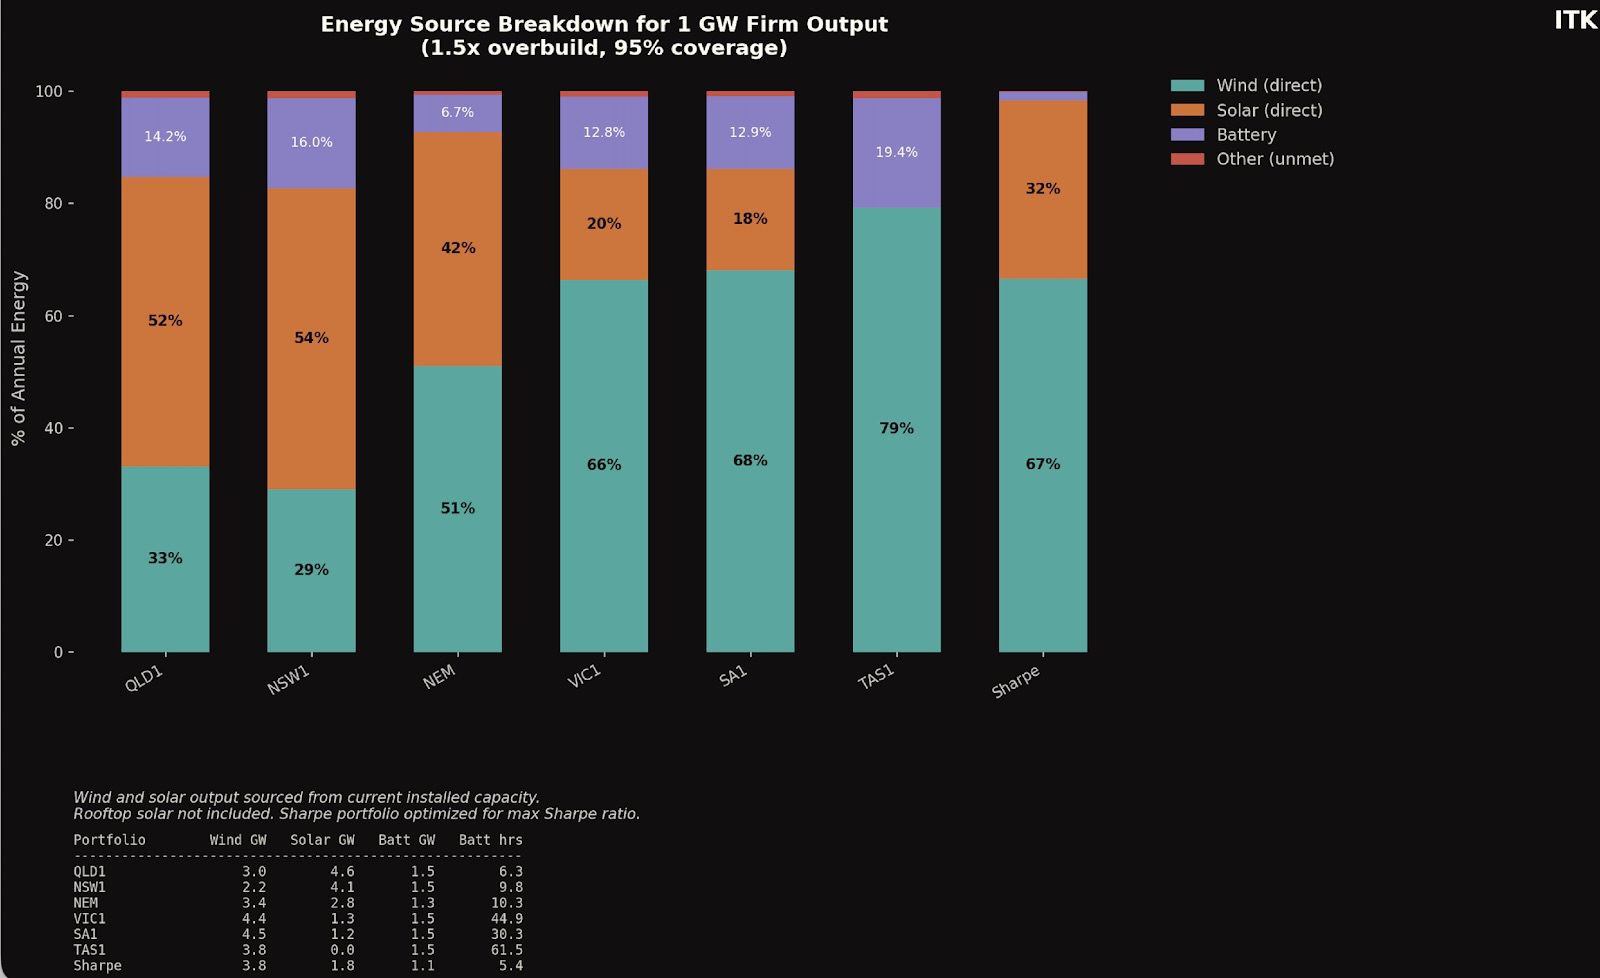
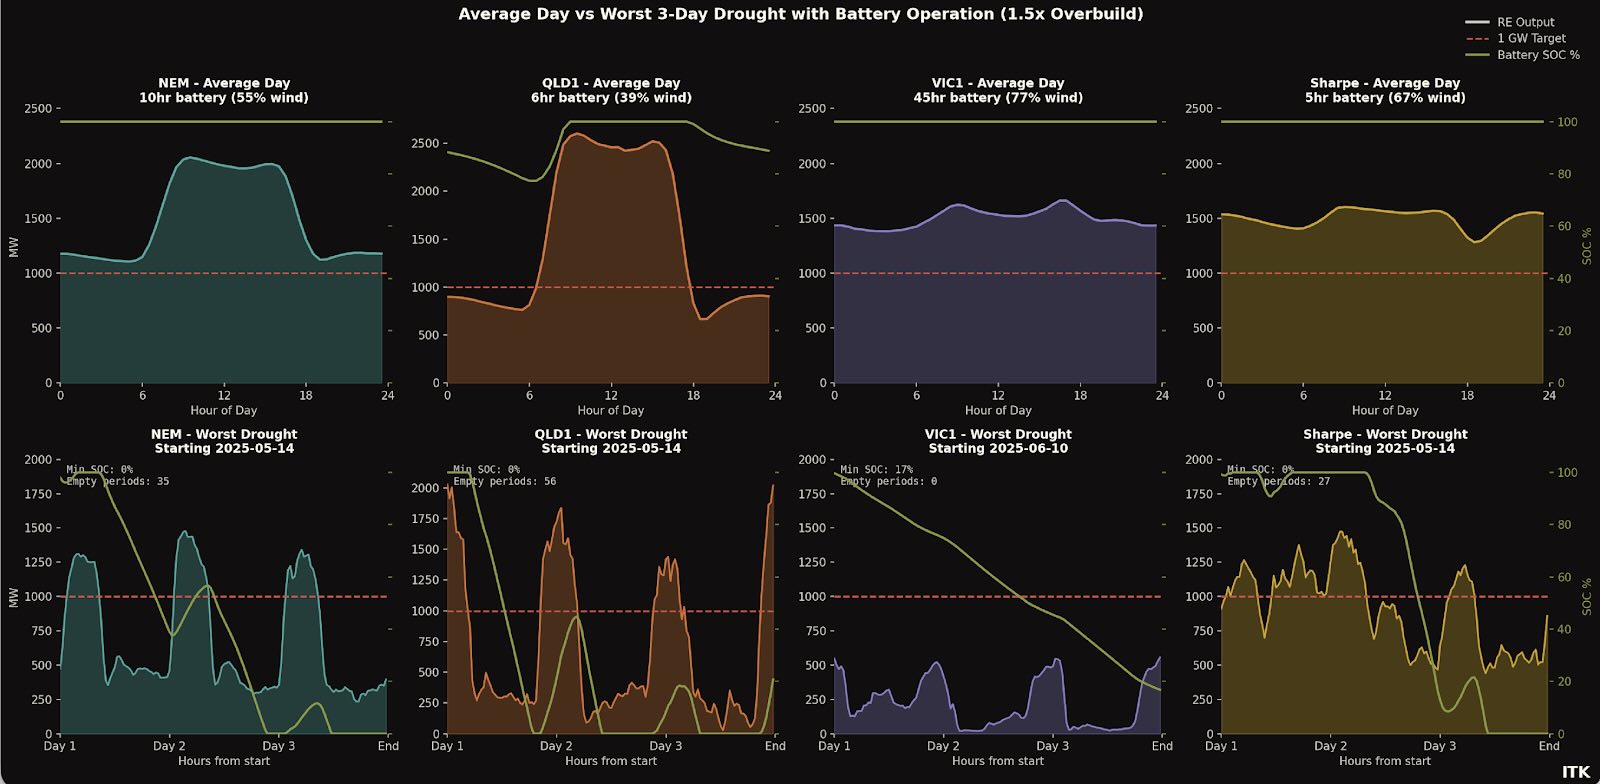
To prove out a point I ran an exercise to firm up a 1000 MW flat load based on wind and solar output over the past 12 months. Shortfalls were met with a battery. A 5% of the hours net shortfall, i.e., empty battery was allowed on the assumption this was met by gas or hydro or whatever. Rooftop solar was not considered. The wind and solar MW contracted provided total output of 1.5X the 8.8 TWh a 1000 MW load requires over the year.
The wind and solar MW simply used the installed capacity in each region and in the NEM as a whole.
There were no charging losses and for the NEM transmission was perfect, zero MLF.
Despite all these unrealistic assumptions the results, which are summarised in the figure below interested me.
You can see the different systems and consequences in the following visualisation. Note the Victorian 43 hour battery doesn’t empty in this situation because I limit the drought to 3 days. There’s a fair bit to take in, in the visualisation.
Figure 4: image-20260129155603158
In a wind heavy market pumped hydro, gas and hydro are needed for occasional use but most of the time will sit idle. In a solar heavy market less pumped hydro, gas and hydro are needed but the batteries will work a lot harder.
The following is a direct quote and explanation of the ESEM from Marija Petkovic, CEO of Energy Synapse as posted on Linkedin. It’s easily the clearest summary I’ve seen.
“Electricity Services Entry Mechanism (ESEM) is a major market reform for project developers. This new mechanism is intended to replace the Capacity Investment Scheme (CIS) in 2027, and will work very differently:
ESEM is moving away from the government underwriting model that has underpinned the CIS and NSW LTESA. Instead, ESEM will be based on standardised contracts (e.g. caps, tolls, VRE profile swaps) that can be traded in financial markets. Big positive is that industry will have a leading role in designing these contracts.
ESEM will be designed to allow developers to recover all their efficient costs, not just the minimum to attract financing as is the case for the CIS.
ESEM will likely cover years 4-15 of a project, which are the most challenging to source in the market. Developers are expected to use existing commercial means to manage revenue risks in the first three years.
ESEM is expected to be open to a wider range of participants, including CER aggregators. The final Nelson Review report also suggests that gas could be eligible, in contrast to the CIS.
ESEM Administrator will “warehouse” ESEM contracts and then progressively sell them back into the forward market to help maintain liquidity. ”
There are two key points. Firstly an ESEM will provide a debt and equity return to projects. So there is no need after that to have any other PPA counterparty. I.e. no need for a Gentailer. Second the ESEM “Administrator” will warehouse the contracts. It should be clear that there is still a lot to understand about the administrator and its balance sheet but let’s assume it all works.
The upshot is that the Administrator will have a large diversified supply portfolio. In the end potentially larger than the portfolio of any gentailer.
Unlike a gentailer though the “Administrator” does not have any clients and the proposal is to gradually unload the contracts into the futures markets. That is gentailers would buy the contracts.
However, now I wonder if this is the best way forward. What if the Administrator worked out its average weighted cost of firmed electricity and sold that to data centres and smelters and other industrial power consumers?
It’s quite possible the Administrator could be the lowest cost source of firmed electricity in the NEM. That’s because it tenders widely and if it was careful could, from the start, aim to offer contracts that produce a high Sharpe Ratio. And then adds the firming into the mix.
There are many complications around interstate basis risk and no doubt governance and implementation issues but to me it seems worth looking at.
Such a move would free up Gentailers from any need to supply industrial customers and they could use their new customer care systems to service the mass and commercial markets in their usual competitive fashion.
The ESEM was originally designed to fit in with a post 2030 NEM review conducted by the Professor Tim Nelson. However, Petkovic—no doubt well informed—states it will start in 2027. That is still too late for my taste.
Big wind farms need to reach FID this calendar year to make a 2030 target. Prior to Christmas I reviewed the status of the big NSW wind farms, collectively close to 10 GW of power.
One of the issues of these proposals was attaining PPAs. AGL, Origin(particularly) and Energy Australia were in no rush for various reasons. Although it is easy to say it was due to protecting the coal generation assets of the above gentailers, it’s also fair in my opinion to blame the very sharp rise in wind generation costs and to assess how permanent those cost increases were.
In any event it seemed like the Federal Government’s determination to keep Tomago aluminium smelter open provided an opportunity to solve a couple of problems at once. Snowy could be directed and no doubt protected to supply renewable power to Tomago. Rio requires renewable power. And to source the power Snowy could write PPAs underwriting development of new wind and/or solar farms in NSW.
Snowy is well set up to write PPAs. It has already a large supply of renewable energy and obviously lots of firming capacity via hydro, gas and now a battery. Snowy also has a mass market retail customer base via Red Energy/Lumo and the systems to manage the customers.
However, increasing Snowy’s role in the market carries its own risks. Were it not for the reasonably widespread ownership of utility batteries Snowy would retain its role as the dominant supplier of firming power.
Indeed, prior to the emergence of utility batteries and their low barriers to entry Snowy’s dominance in firming would likely have increased as coal exited the market.
In my view if the “Administrator” is going to be writing the contracts it might as well be supplying the customer.
And in this model of ESEMs Gentailers will have to decide whether they want to compete with the Government to underwrite new projects, or whether it’s better to hand the entire job to the Government and just buy what they need in the secondary market, or go unhedged and buy from the spot market.
Equally if the gentailers don’t write their own contracts they will have to buy from the “administrator” and that may not be a great bargaining position.
Legal bid to overturn state approval of a NSW wind project ends with a whimper,…
Safety has become one of the most defining priorities for solar and energy storage developers.…
The latest gas market outlook is less of a temporary supply-gap reprieve and more the…
Andrew Forrest says fossil fuels carry volatility, political cost and risks for mums and dads…
Tony Abbott's climate attacks inspired a local community to build a first of its kind…
A solar farm inspired by Tony Abbott's climate attacks has finally been opened. Mhairi Fraser…