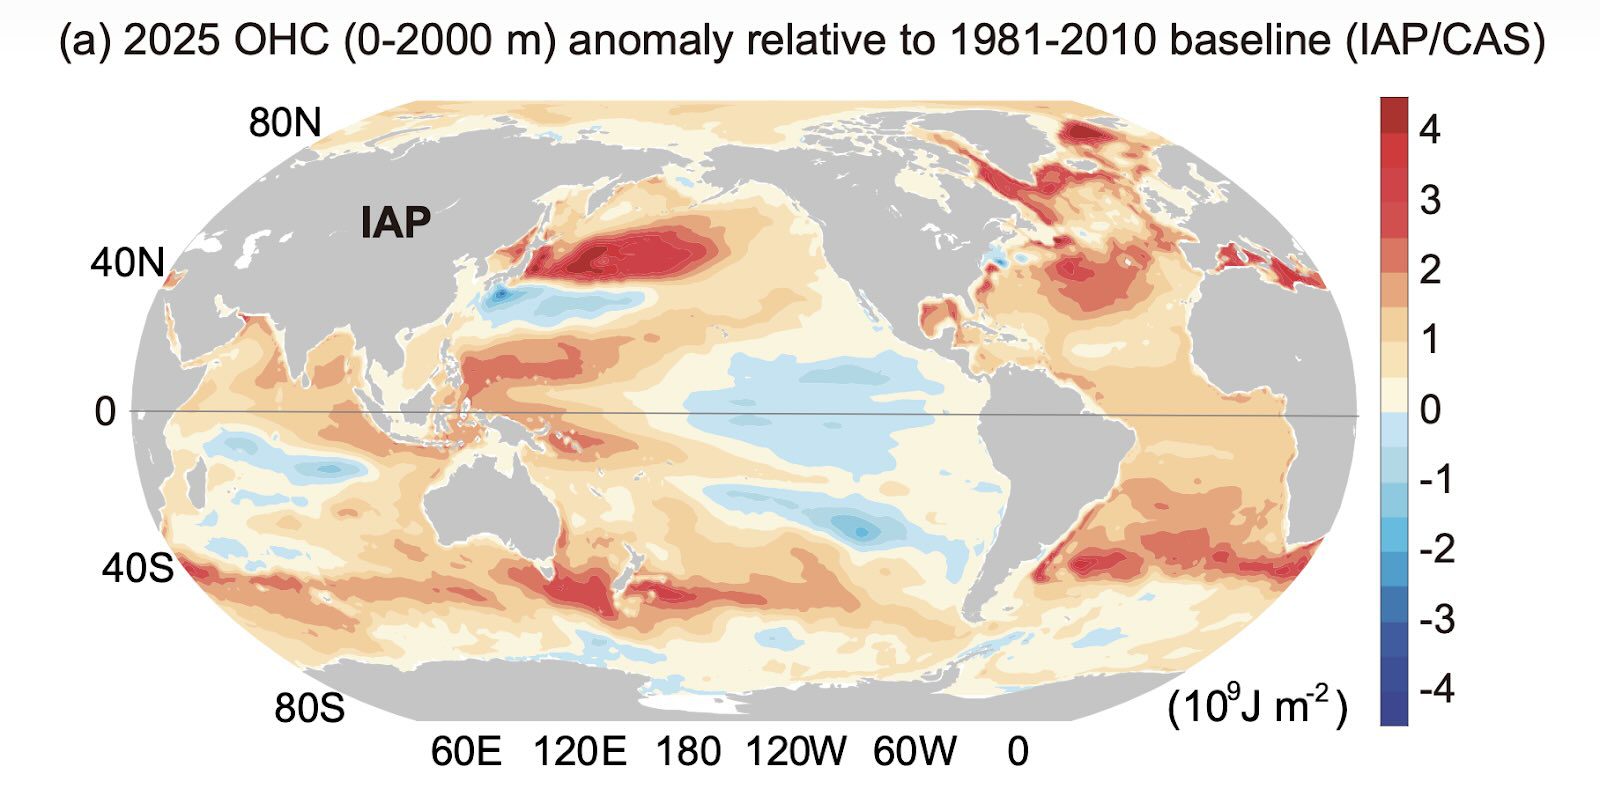
Global ocean heat content increased by approximately 23 zetajoules (ZJ) in 2025, roughly 40 times annual global primary energy consumption.
Waters off Australia’s east coast are among the fastest-warming globally due to the intersection of expanding Hadley circulation, Pacific heat redistribution, and the East Australian Current.
As oceans expert Matthew England discusses in the latest episode of Renew Economy’s Energy Insiders podcast there are key consequences for Australia:
This section is almost entirely sourced from: Ocean Heat Content sets another record in 2025. This 2025 update is part of a series that is promptly updated every year in January of the following year. Considering the many authors from varying countries, primarily China and the USA, it’s a great example of how things can be done efficiently.
In summary global ocean heat content in the upper 2km of the ocean increased by about 23 ZJ +- 8 ZJ. 23 ZJ is approximately 40X the amount of global primary energy humans produce each year.
The cumulative change since 1960 is at about 400 ZJ.
Figure 1: Ocean Heat Change. Source: Pan et alia 2026
There are three different data sets for measuring OHC but two of them go back a lot further. They use a combination of satellite and in-situ measurements. The data comes from the World Ocean Database and the Argo real-time data centre.
Argo is about 4,000 drifting floats weighing about 20-30 kg at a depth of 1,000 metres. Every 10 days they dive to 2,000 metres of depth and then surface, measuring conductivity, temperature and pressure. The leading person in the Argo program was Dean Roemmich, an American physical oceanographer.
Since 2011 China’s FenYun-3 satellite returns Microwave Radiation Imager Sea Surface temperature and this is used along with ship records and the Argo system to provide data back to 1850.
Waters off the East Coast in Australia are in the fastest warming waters in the world. First look at 2025:
Then you can see from the following map that 2025 is simply another pass of the saw and that warming is consistently high along the Eastern Australian latitudes.
Figure 2: Cumulative increase. Source: Pan et alia
Hadley circulation is a planet-scale system that moves heat from the equator toward the subtropics. Strong sunlight heats the equator, causing warm air to rise.
This air flows poleward high in the atmosphere, then sinks around 20–35° latitude in each hemisphere. Surface winds return air toward the equator as the trade winds. Where air sinks, skies are clearer, rainfall is suppressed, and the surface warms more efficiently.
Climate change is pushing the Hadley circulation poleward, especially in the Southern Hemisphere. The tropics are warming faster than higher latitudes, the upper atmosphere is cooling, and the Southern Hemisphere westerly winds are strengthening and shifting south.
For eastern Australia, this means more persistent high-pressure systems, fewer clouds, more sunlight reaching the ocean, and less cooling from evaporation—all of which accelerates surface ocean warming.
It’s named after George Hadley, who published the foundational work in 17351.
Figure 3: Hadley cells. Source: Lyndon State
There are also polar cells and “Ferrel cells” in between the polar and Hadley cells.
Figure 4: Tropical air circulation. Source: Britannica
When I read on this topic the “Walker circulation and ENSO” also came up. The Walker circulation is an east–west circulation along the equator across the Pacific Ocean. Warm water piles up in the western Pacific near Indonesia and northern Australia, where warm air rises to produce clouds and rain.
Air flows eastward aloft and sinks over the eastern Pacific, with trade winds completing the loop. El Niño shifts warm water eastward and often dries eastern Australia, while La Niña strengthens trade winds and cools the central Pacific.
However, La Niña also pushes heat into the subtropics, meaning waters off eastern Australia can continue warming even during La Niña years. Walker circulation is reckoned to contribute to East Coast of Australia ocean warming.
Eastern Australia lies in a subtropical warming band between 20–40°S, where the expanding Hadley circulation, ENSO heat redistribution, and the East Australian Current all concentrate warmth along the coast.
Meanwhile, the Southern Ocean—though it absorbs more heat than any other ocean—influences wind patterns and circulation that set the background conditions for this subtropical warming.
The ocean off Australia’s east coast is warming faster because it sits at the intersection of expanding atmospheric circulation, shifting Pacific heat patterns, and strong ocean currents that funnel heat toward the coast. This is a structural, long-term change—not a short-term fluctuation.
In summary, most global warming is stored in the oceans. The Hadley cycle, Walker circulation, and East Australian Current combine to concentrate this warming off Australia’s south-east coast, making it one of the fastest-warming marine regions globally.
So identification of a hot spot is only the first issue; let’s move on to some implications. Once again bear in mind that a little knowledge, and I have virtually none, is a dangerous thing. Almost nothing is worse than an overconfident but basically incorrect analyst. After all who needs ‘mansplaining’ when we have analysts.
The first point is temperature change. According to the CSIRO the Western Tasman shows a sea surface temperature that is about 1°C warmer than 1980. Some areas along Eastern Australian Shelf are reported to show warming as much as 0.5°C per decade.
Figure 5: EAC hotspots. Source: Malan et alia 2020
Let’s go through the expected impacts not just of the ocean heat but warming, acidification and sea level rise as it applies to Australia.
Warmer waters in the eastern and southern Tasman Sea do not usually change the direction of Australia’s onshore winds, which are primarily controlled by large-scale pressure systems.
However, they do increase evaporation and humidity, meaning that when easterly or northeasterly winds blow onshore, they carry substantially more moisture.
Warm SSTs also help sustain persistent onshore flow during blocking weather patterns and reduce cooling of marine air masses, increasing the likelihood of heavy rainfall once uplift occurs.
However, there is some evidence that onshore winds last longer in blocking patterns e.g. the NOAA CPC states “The normal eastward progression of synoptic disturbances is obstructed leading to episodes of prolonged extreme weather conditions.”
The 2015/16 Tasman Sea marine heatwave is linked with severe ecological impacts, including major kelp die-offs off eastern Tasmania. Broader syntheses document repeated kelp die-backs and biological disruptions during extreme warm events.
I read that whereas 90% of global warming turns up as an increase in ocean heat content, just 25% of the actual CO2 ends up in the oceans. It turns out that the CO2 increase occurs close to the surface. Warmer waters are worse at absorbing CO2 and this preconditions the waters to have a lower pH.
So this may mean shell-forming organisms have slower growth and weaker shells and higher larval mortality. Apparently the change in Ocean pH is logarithmic. That is a 0.1 drop in pH is about a 25% increase in acidity. And we have already had a drop of 0.1 pH globally.
Sea levels around Australia are estimated to have risen about 20 cm over the past 100 years or so and the available evidence is that sea level rises globally are accelerating. Based on a quadratic model forecast by 2050 sea levels around Australia are likely to have increased another 15 cm. Sea levels are measured using satellite data.
With the launch of the Sentinel-6 Michael Freilich satellite in 2020, the satellite radar altimeter record of sea level has surpassed 30 years in length.
This record of near-global observations of sea surface height has led to definitive measurements of not just the net increase in global mean sea level (GMSL), but also the increasing rate at which GMSL is rising
Figure 6: Sea level rise. Source: Hamlington and others
The 20 cm of sea level rise we have already had raises the baseline. Every high tide is 20 cm higher, storm surges come on top of that.
Another 15 cm of sea level rise is, in my opinion, pretty much locked in by 2050, that is over the next 25 years. All of the events listed above are likely to become even more emphasised and probably faster than we can easily build resilience.
It’s hard to repair roads if they are getting washed away every few years, the cost will become unbearable.
As an ex investment banking analyst one of the most interesting articles I read last year was a piece in Bloomberg noting that disaster recovery on one measure accounted for a significant share of USA GDP growth and that a basket of shares exposed to disaster recovery had materially outperformed the broad USA share price indexes.
On one view the per year spend is up about 10X over the past 20 years.
Some industries that benefit at least in the USA are insurers and waste haulers, power grid equipment manufacturers and engineering contractors, hardware stores and self-storage facilities. These are good businesses to be in challenging times.
Figure 7: Prepare and repair index. Source: Bloomberg
Climate Weather Linkage: Atmospheric Blocking – NOAA Climate Prediction Center
When conflicts affect global oil and gas routes, Australians feel it. But Australia has all the…
Community focused retailer launches first of seven batteries to be deployed across regional Victoria and…
The Australian trucking industry is about to experience an electric revolution, with plunging battery prices…
Latest grid ratings include bad news for solar farms in some areas, but a boost…
Final panel installed at Australia's first large scale solar-battery hybrid facility to connect to the…
Plans to develop a 1GW wind farm in waters off the coast of Gippsland have…