Vic to NSW actual exports, compared to limit, Source: NEM Review
It is now abundantly clear that not enough transmission was built before solar got going in Victoria and NSW.
The above graph shows a rolling 90 day average of actual exports northward from Victoria to NSW between the hours of 10:00 am and 3:00 pm, and the prescribed limit from the Australian Energy Market Operator.
These times were chosen because that’s when solar operates, and it’s clear that there is not much headroom.
I will leave others to decide what to do about it, but it’s quite possible that the situation will get worse before it gets better.
That’s because when Stage 1 of the Project Energy Connect – the new link between South Australia and NSW – is completed then more power can flow South and East, but no more can flow North.
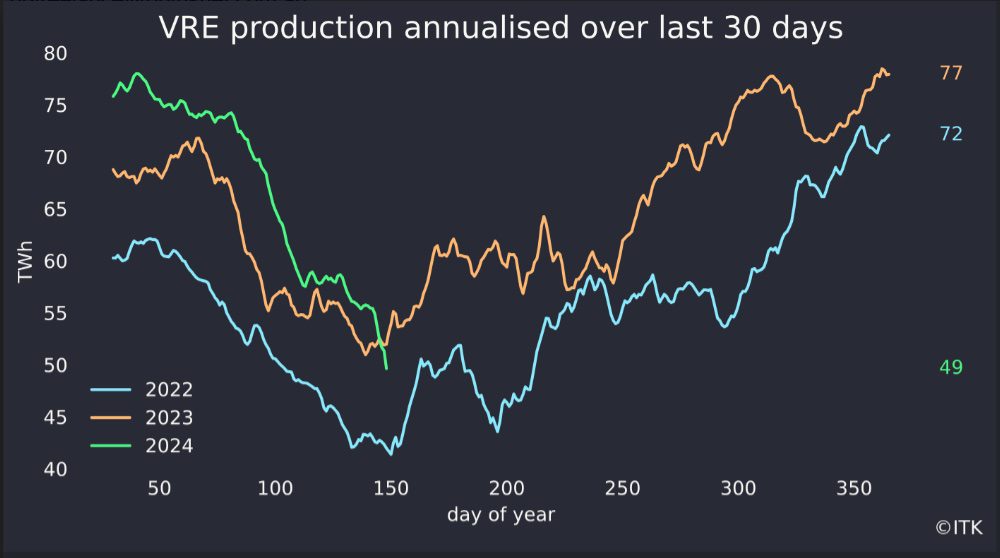
VRE production, Source: NEM Review
Solar is seasonally soft, but this year there has been a wind drought.
Of course the anti-renewables crowd will point to this, but I am fairly confident that when some of the 3 GW of wind projects in Queensland come online over the next 18 months, the fact that Queensland’s wind does well in winter will be a help.
VRE by fuel. Source: NEM Review
Spot prices. Source: NEM review
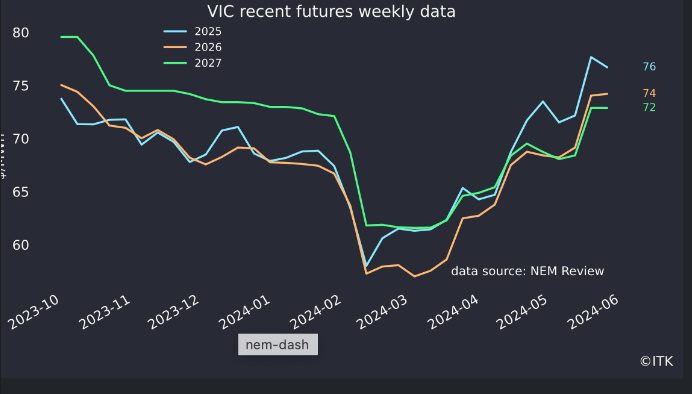
Vic futures. Source: NEM Review
Nearly five months after completing its final concrete pour, King Rocks wind farm has received…
Bowen says data centres could rescue stalled renewables as he warns coal-fired power stations are…
Super-affordable solar and battery offer from the German discount supermarket chain has now been extended…
Large-scale solar generated record high shares of electricity in every Australian state but one over…
Independent panel receives 19 new submissions on solar and battery project, but cancelled a scheduled…
US aluminium giant agrees to evaluate potential deployment of vanadium flow battery technology at its…