Vic to NSW actual exports, compared to limit, Source: NEM Review
It is now abundantly clear that not enough transmission was built before solar got going in Victoria and NSW.
The above graph shows a rolling 90 day average of actual exports northward from Victoria to NSW between the hours of 10:00 am and 3:00 pm, and the prescribed limit from the Australian Energy Market Operator.
These times were chosen because that’s when solar operates, and it’s clear that there is not much headroom.
I will leave others to decide what to do about it, but it’s quite possible that the situation will get worse before it gets better.
That’s because when Stage 1 of the Project Energy Connect – the new link between South Australia and NSW – is completed then more power can flow South and East, but no more can flow North.
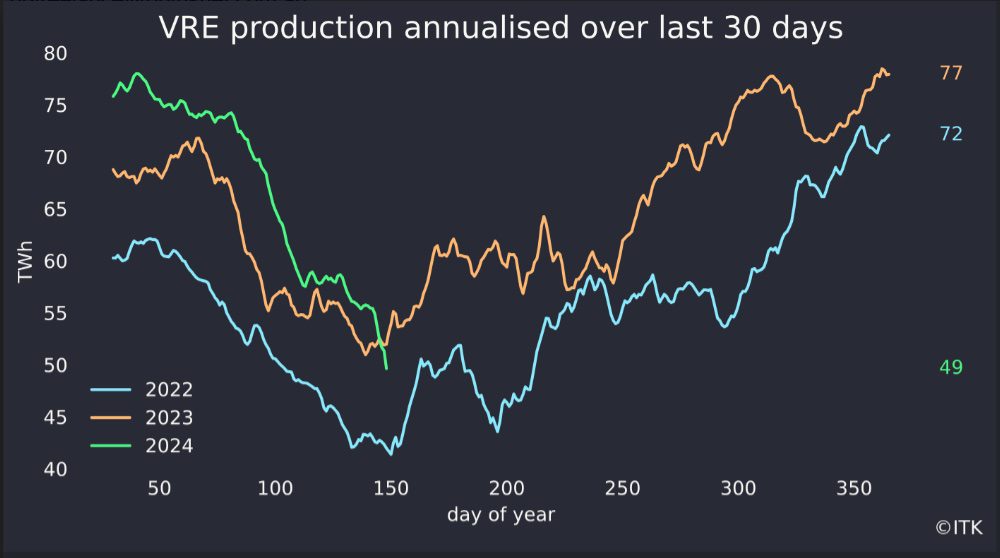
VRE production, Source: NEM Review
Solar is seasonally soft, but this year there has been a wind drought.
Of course the anti-renewables crowd will point to this, but I am fairly confident that when some of the 3 GW of wind projects in Queensland come online over the next 18 months, the fact that Queensland’s wind does well in winter will be a help.
VRE by fuel. Source: NEM Review
Spot prices. Source: NEM review
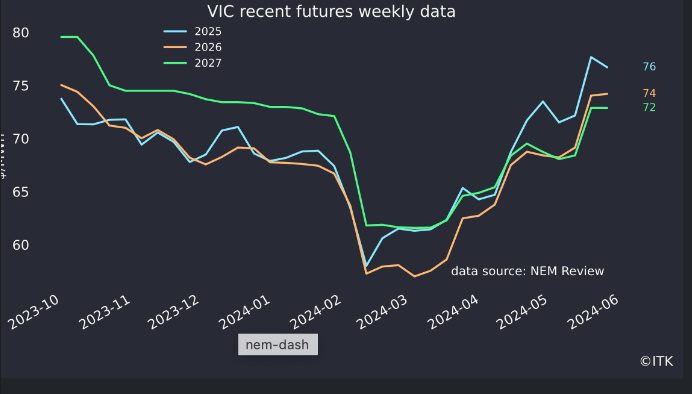
Vic futures. Source: NEM Review
A wind turbine with a record-breaking hub height of more than 200 metres has been…
As opposition parties talk nuclear, a new global report from energy experts say it would…
Australia's most powerful battery now free to trade its full capacity on market after its…
The site of one of Australia's very first wind farms now shows little evidence of…
The "35 by 35" electrification goal has an Australian origin that the government seems to…
If we fail to ensure data centres pay for new renewables and storage to cover…