Flat Rocks Wind Farm. Source: Potentia Energy
In a week where Western Australia’s renewable energy progress – or the lack, thereof – was a topic of hot political debate, the state that is home to the world’s most isolated grid has topped the charts for best performing assets in both large-scale solar and wind, for the month of February.
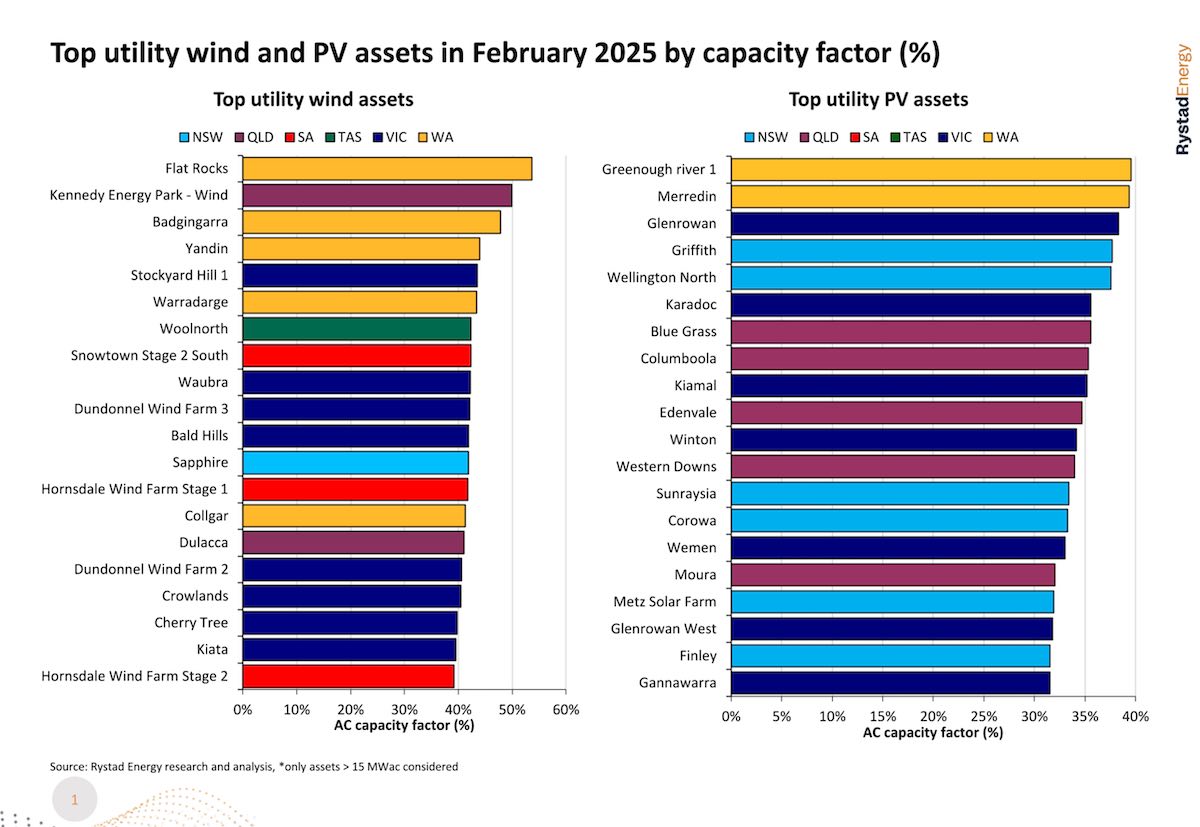
According to the latest data from Rystad Energy, Western Australia’s main grid was home to four of the 10 best performing wind assets for February, with Potentia Energy’s small but punchy 18 turbine Flat Rocks wind farm taking out top spot with a capacity factor (CF) of 53.7 per cent.
And while Queensland’s much bigger Kennedy Energy Park came in second (49.9% CF), WA wind farms also occupied third place – APA Group’s Badgingarra (47.8% CF) – as well as fourth and sixth; the Yatch Australia / Alinta Energy Yandin wind farm and Bright Energy Investments’ 180 MW Warradarge wind farm, respectively.
Tasmania’s Woolnorth wind farm – owned by Shenhua Group (75%) and Hydro Tasmania (25%) also made the top 10, sliding in at number seven with a capacity factor of about 44 per cent.
For utility PV the best performing assets for the month were also in Western Australia, including the Potentia Energy and Synergy co-owned Greenough River solar farm in top spot with a capacity factor of 39.6 per cent, and SUN Energy’s Merredin solar farm in second place (39.4% AC CF)
The third best rating solar farm for February was the Glenrowan project in Victoria, with a capacity factor of 38.3 per cent.
All up, all Australian utility PV and wind assets generated a total of 4,519 GWh in February 2025, up 14% from 3,947 GWh in February 2024.
New South Wales topped the states, according to Rystad Energy’s David Dixon, generating 1,324 GWh with 813 GWh from utility PV and 511 GWh from wind.
The renewable energy generation share of the National Electricity Market (PV, wind, hydro & biomass) reached 44% over the course of the month, marking the first time above 40% for a February. Western Australia’s Wholesale Energy Market (WEM) reached 42% renewables in February 2025 up from 37% last February.
Dixon also notes that there were 645 hours of negative prices across NEM / WEM states for the month, with South Australia contributing the most with 222 hours of negative prices or ~33% of the month.
Battery expert Iola Hughes from Rho Motion on the latest trends, developments and date on…
Developer hopes to race through the federal and state planning processes with construction pegged to…
Federal Labor's light touch environmental review of a massive new fracking industry threatens one of…
Ausgrid-owned Plus Es will start rolling out its 1000 pole-mounted EV chargers next week after…
Delta hopes to make a final decision on whether to invest in a battery for…
New report underscores concerns that keeping ageing Eraring coal plant open could result in higher…