The Berrybank wind farm in Victoria. Image: Naturgy
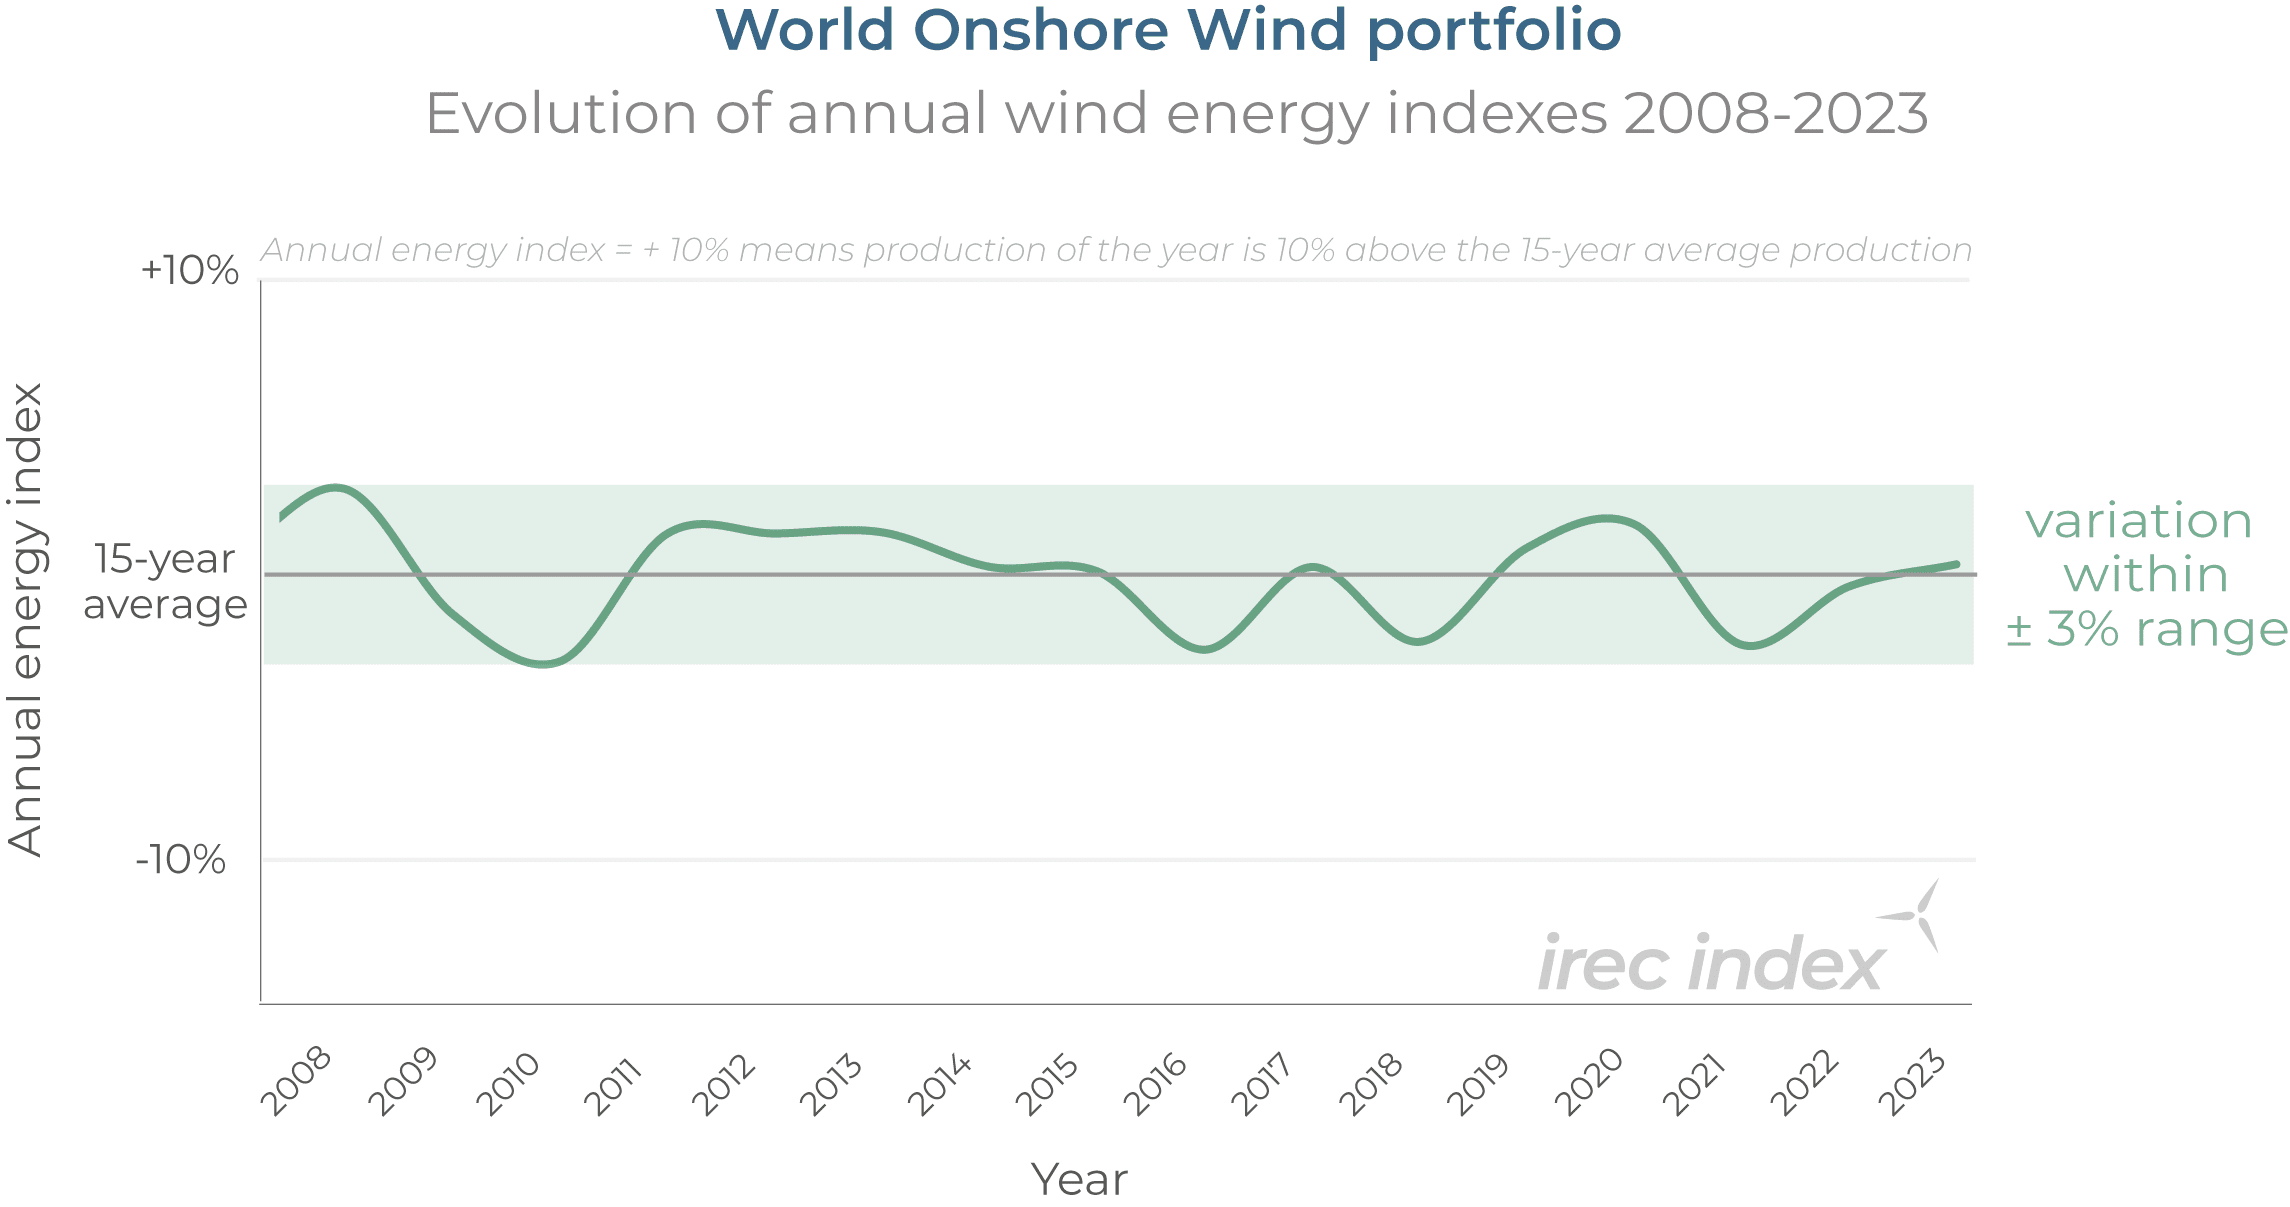
Wind energy generation may be variable, as anti-renewables folk love to point out, but a new study has found that wind power production from operating projects is actually “very predictable,” with annual variations falling within a range of plus or minus 3 per cent, worldwide.
The study, published this week by renewables resource assessment consultancy Eoltech, assesses the variations of the global wind resource over the last 15 years.
The study is based on Eoltech’s monthly wind energy indexes for 300 geographical areas worldwide – including Australia – that have the highest concentration of wind farms.
Using this data, Eoltech created a Global Index, covering geographical areas that host about 80% of the world’s operating onshore wind farms as of 2023, and a European Index, which covers 97% of the continent’s operating wind farms.
The Global Index shows that wind resource annual variations are within a ± 3% range, worldwide, while the European Index shows annual variations in a range of ± 7%.
As the map below indicates, the regions covered by the index in Australia compare very well – particularly south-western Victoria, where there was negligible annual variation over the course of 2023.
“Locally, the production of a wind farm can differ significantly from one year to another, up to 25%, due to the variation of the wind resource,” explains Eoltech CEO Habib Leseney.
“But on a larger scale (Europe, World), accumulated production is much more stable.”
“It should also be noted that our analysis does not show any downward trend over the last 15 years in the global wind resource. Yes, the wind does always blow somewhere on the planet, and it is good news for wind power going forward,” Leseney says.
Eoltech says its Irec index design now includes ERA5 data, one of the latest climate reanalysis data sets produced by the European Centre for Medium-Range Weather Forecasts (ECMWF) – an indicator used by wind farm owners to compare their production variation from one period to another.
“Irec index is used to monitor hundreds of wind farms in operation worldwide,” says Eoltech Technical lead Marion Jude.
“This monthly indicator enables … an overview of the production capacity of the entire portfolio and its evolution over time. It helps to complement the in-depth analysis of SCADA monitoring data carried out by the operator,” Jude says.
Goldwind's John Titchen explains why and how all new wind turbines could come with their…
Australia’s biggest energy retailer reports significant dip in gas sales, as customer demand falls and…
The energy ministers of Australia's two most coal dependent states come face to face. One…
The CIS has not worked. But the capacity it was designed to procure is needed…
Federal government's green bank expands partnership with big-four bank offering discounted finance for business to…
Fortescue says it can build green power for data centres and other energy users faster…