Source: Freepik
Australia stands at the threshold of one of the world’s most profound energy transformations: shifting from thermal dominance– primarily coal and gas– to a renewables and storage-led system powered by abundant, free solar.
Electrification is expected to roughly double electricity demand to 500 TWh a year by 2050, equivalent to the electricity consumption of major industrial countries such as Germany, France, and South Korea, while coal plants retire faster.
The numbers are staggering and the pace is accelerating. The question is not whether the system can adapt, but how quickly it can harness storage to manage intermittency without compromising reliability, paving the way for Australia to become a renewable energy superpower.
In the 1960s, Soviet astronomer Nikolai Kardashev proposed a method for measuring a civilization’s level of technological advancement based on their ability to harness energy, which provided a useful basis in scanning the stars for signs of life.
Broadly speaking, a Type I civilization controls all of the energy received by its local star at the planet’s surface, a Type II civilization harnesses the total energy output of the parent star (often visualised as a Dyson sphere) and a Type III civilization: commands the energy of an entire galaxy, something even the boldest futurists have difficulty in describing.
Carl Sagan, visionary astronomer and communicator, further developed and popularised this concept in 1973 as a logarithmic formula based on the total power use (P) of a civilisation.
Our local star, the Sun, generates an incredible 3.8 x 1024 W, or 380 trillion Terawatts (TW) of power. After travelling 150 million kilometres to Earth in a little over 8 minutes, roughly 120,000 TW reaches Earth’s surface as solar insolation. The sun powers life on our planet, and every form of fossil fuel via photosynthesis over millions of years. Renewables capture that energy directly.
According to the latest International Energy Association (IEA) data, humanity’s total primary energy consumption is approximately 650 exajoules (EJ) of energy per year, that’s energy from all sources from fossil fuels and nuclear, through to renewables and everything in between. An exajoule is 1018 J, and to make it a meaningful comparison we can convert this to the average power over a year, which equate to 20 Terawatts (TW).
Looking into electrification, only around 15% (2.8 TW) of this power is used in the electrical power system globally, with the rest being used directly via combustion thermally.
On the Kardashev scale, humanity is at 0.73, meaning we are only using roughly one ten-thousandth of the energy arriving from our local star, less than half an hour of solar generation per year to power the planet. There is no shortage of energy available to the system, in fact there is an abundance.
In Australia, the scale of this opportunity is immediately evident. The country receives an average of 1,800 TW of solar power – 100 times the entire primary energy consumption of the planet.
In 2024, Australia’s total primary energy consumption was 5997 PJ, roughly 186 GW of average power, excluding exports. Australia therefore receives 10,000 times more energy than what is needed domestically. Less than 20 minutes of peak solar generation would fulfill all of Australia’s primary energy needs for a year, and less than 3 minutes to power the entire electrical grid.
Australia is an energy superpower, exporting almost 1500 PJ (black coal and Liquified Natural Gas predominantly) per year (472 GW), 2.5 times our total primary consumption, an enormous amount though dwarfed by the renewable potential.
However, for transport we consume 1604 PJ (480TWh) of liquid fuels (petrol/diesel), with 90% of these imported and subject to economic and security impacts outside of our sovereign control.
Electrifying the transport sector is well underway, comparing the average Internal Combustion Engine (ICE) vehicle consumption of 12.8L/100km, this equates to 1250Wh/km, compared to the average EV consumption of 150 Wh/km showing the remarkable energy efficiency of EVs, as well as the remarkable inefficiency of ICE vehicles.
Illustrating this point: one million EVs would require just 2 TWh of electricity per year to run – less than 1% of annual demand. Yet this displaces 1500 ML (58 PJ) of imported fuel consumption, equivalent to about 10 days of consumption or roughly a third of Australia’s fuel reserves.
In terms of impact to consumers, 1500ML of fuel costs $3.75b (at $2.50/L), as opposed to 2 TWh at $160m (at commonly available 8c/kWh overnight charging rates), a more than 95% saving of $3.59 and commensurate
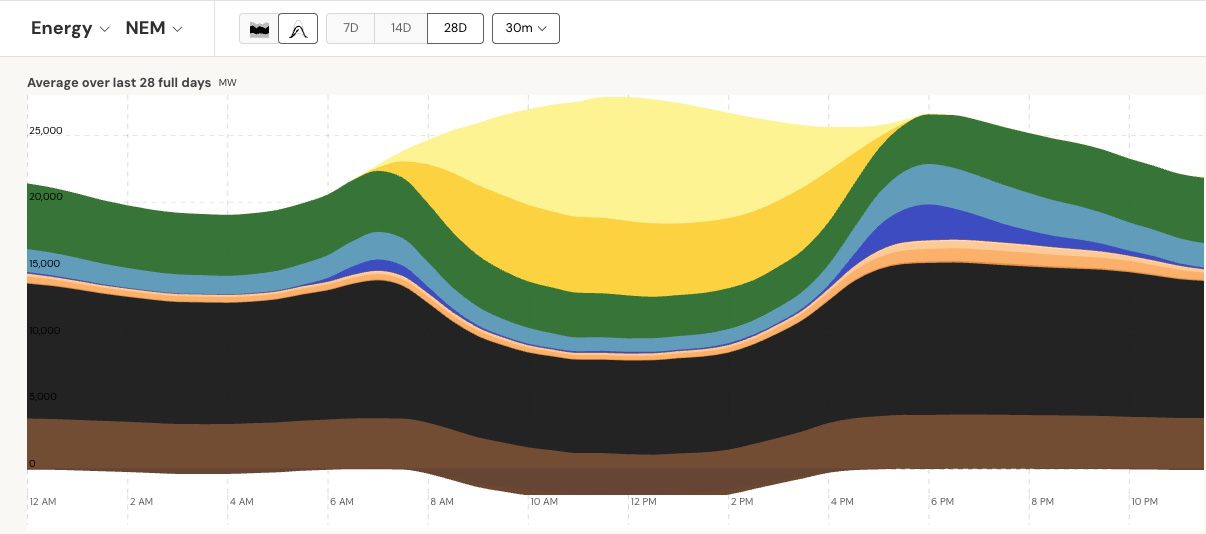
To illustrate the Kardashev scale’s vision of solar abundance in action, consider Australia’s grids, where renewables are steadily displacing thermal sources. Fifteen years ago, the National Electricity Market (NEM) generation mix was dominated by coal at approximately 80%.
Today, coal’s share of total generation has fallen below 50% and continues to fall each year. In 2025, gross electricity generation in the NEM, including behind-the-meter rooftop solar, was roughly 220 TWh, with 30 TWh (13% of generation) from rooftop solar alone.
This is a staggering transition in less than 10 years and is expected to continue at pace. Utility-scale batteries now shift around 1% of generation (1.7 TWh), tripling since 2024. Residential home batteries are ramping up solar self-consumption behind the meter and will increasingly shape net grid demand.
Rooftop solar now routinely exceeds 10 GW during the day, while utility-scale renewables have displaced thermal generation to an extraordinary degree.
Coal and Combined Cycle Gas Turbines that once operated as baseload are now routinely ramped down to 50% or lower during the day, with individual units bidding out of the market — behaviour that would have been unthinkable a decade ago.
The classic “duck curve” is becoming deeper and more pronounced, with midday net loads collapsing and evening ramps becoming ever steeper. Gas-powered generation has also declined sharply, from around 10% of NEM energy 10 years ago to approximately 4% in 2025, although there is still a live debate about its role during periods of regional low-renewable generation.
May 2026 average generation profile for the NEM (Open Elecricity)
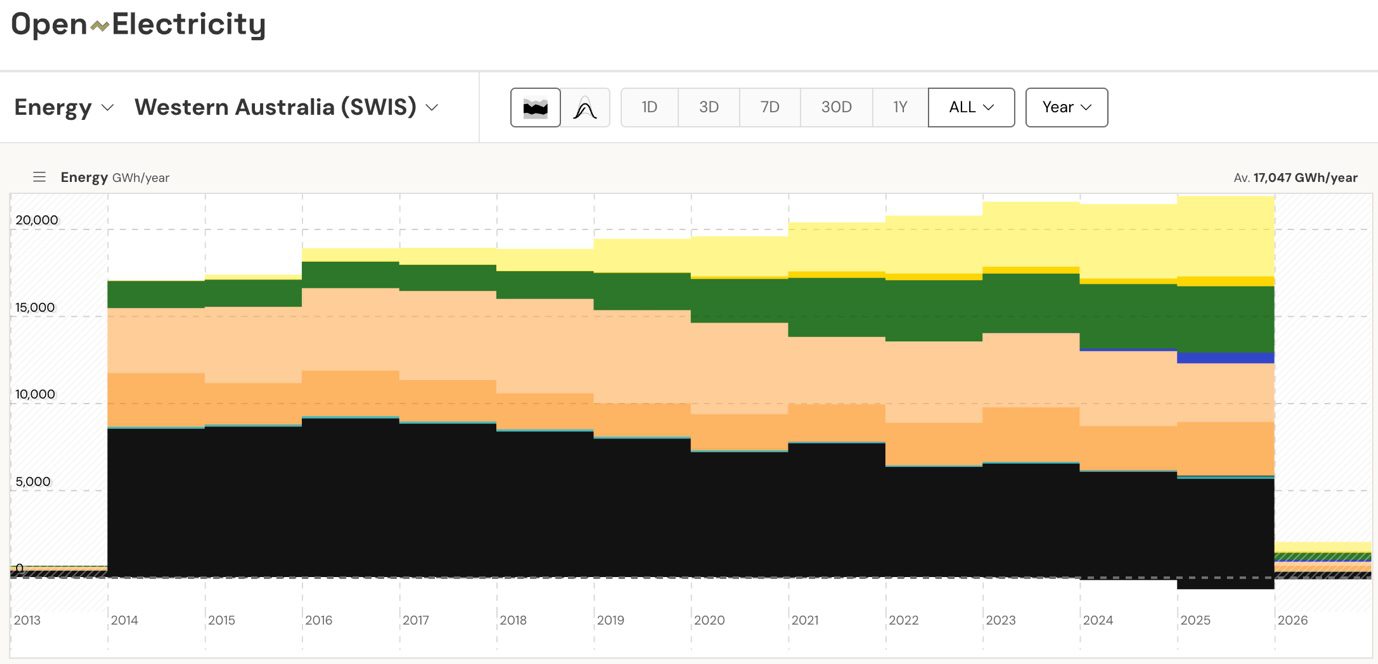
In Western Australia, the smaller South West Interconnected System (SWIS) has had a much more dramatic transition: In 2015, SWIS gross generation was 17 TWh (50% coal, 40% gas, 10% wind, negligible solar); by 2025, the mix is 28% coal and 28% gas, with extraordinary rooftop-solar generation of over 20%. Battery generation hit 3% of gross generation and is expected to almost double in 2026.
These shifts from thermal reliance to solar and battery displacement show Australia’s accelerating path to energy plenty, where intermittent renewables are rapidly becoming the grid’s reliable backbone and setting the stage for exponential scaling in the years ahead.
Open Electricity – Annual SWIS Energy (Open Electricity)
Australia is not facing an energy shortage; we are surrounded by abundance. The challenge is one of timing, location, and system management. Yet at the same time, renewable curtailment is continually rising, hitting 7,200 GWh in 2025 (almost double the previous year’s figure).
Utility-scale batteries, deployed at scale and integrated intelligently, can resolve this by converting intermittent renewable generation into firm, dispatchable, low-emissions energy, enabling the retirement of the last coal plants without compromising reliability.
The transition is not a question of if, but of how quickly and how smoothly. By clearing paths for more solar and storage today, we secure our place in the AI/data centre boom and unlock sovereign manufacturing potential.
We’ve been building this ecosystem for decades – the technology is here. Australia can seize it to emerge as a true renewable energy superpower. The economics make sense for powering our economy on the lowest-cost energy on Earth, advancing us further along the Kardashev scale.
Josef Tadich is regional director, APAC, for Tesla Energy.
A government-owned power company that can sell electricity for 44 per cent less than market…
A new framework will help determine the cost of different measures to shift or reduce…
Dozens of residents and farmers protest against Marinus Link and its associated infrastructure, as minister…
UN says still some uncertainty about power of expected El Nino event, but warns that…
Urgent action must be taken to regulate power and water used by data centres to…
Changes to Cheaper Home Batteries scheme takes some heat out of a red-hot market –…