Modern electricity meters report electricity consumption and exports separately. However, on-site consumption of PV output is invisible to the meter, and shows up as a reduction in electricity consumption.
The electricity grid is blind to this, and simply shows it as a reduction in electricity consumption. This can be incorrectly attributed to energy efficiency improvement when it is really PV output. And the lower visible PV generation in winter can be incorrectly described as a ‘solar rebound’ based on simplistic economic theory.
Does this really matter? Yes, it does.
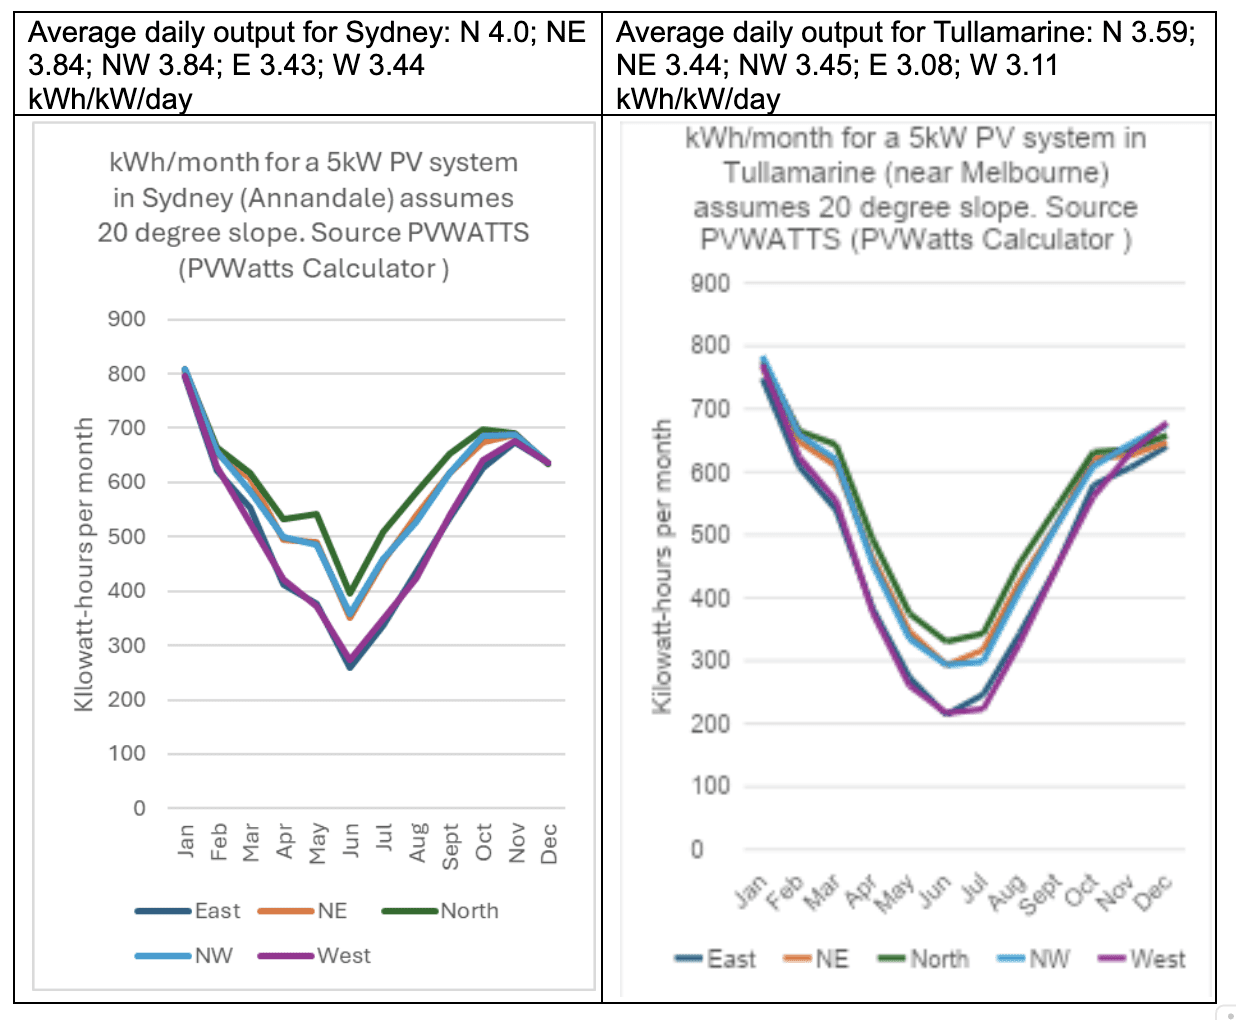
As we electrify buildings and install on-site PV, winter demand for electric space heating can increase – if we don’t drive building and equipment energy efficiency. But winter PV generation is much lower than most of the rest of the year, as shown in the graphs below.
Cold cloudy days coincide with high heating demand, low PV generation and lower heat pump efficiency. Heat pump efficiency declines by about 2 percent per extra degree of temperature difference across the appliance.
In extreme weather, ‘icing up’ may occur, which can significantly reduce efficiency and requires defrosting, which reduces the available heat output.
On-site consumption of the limited winter PV output also increases at the expense of exports, due to more electric space heating, lighting and time at home, as well as higher losses from hot water storage tanks and lower efficiency of hot water heat pumps. This amplifies the gap between summer and winter visible PV exports recorded by a meter.
The situation for commercial and industrial on-site PV and other generation is very different from the residential situation, with significant implications.
Most of these systems export little or none of their PV generation because it is a relatively small proportion of their electricity use. So their electricity bills will show little or no PV generation at all. It will be counted as a reduction in consumption. Imports of electricity in winter may also be higher, to replace the lower PV winter output.
Just looking at meter data will mask a challenge regarding balancing winter electricity supply and demand. Much of the difference between underlying winter electricity consumption and the rest of the year is driven by buildings, and weather-driven peaks on cold, windy, often cloudy days.
At these times, gas generation is often needed, especially in South Australia (see openelectricity.org.au which shows temperatures as well as consumption for states).
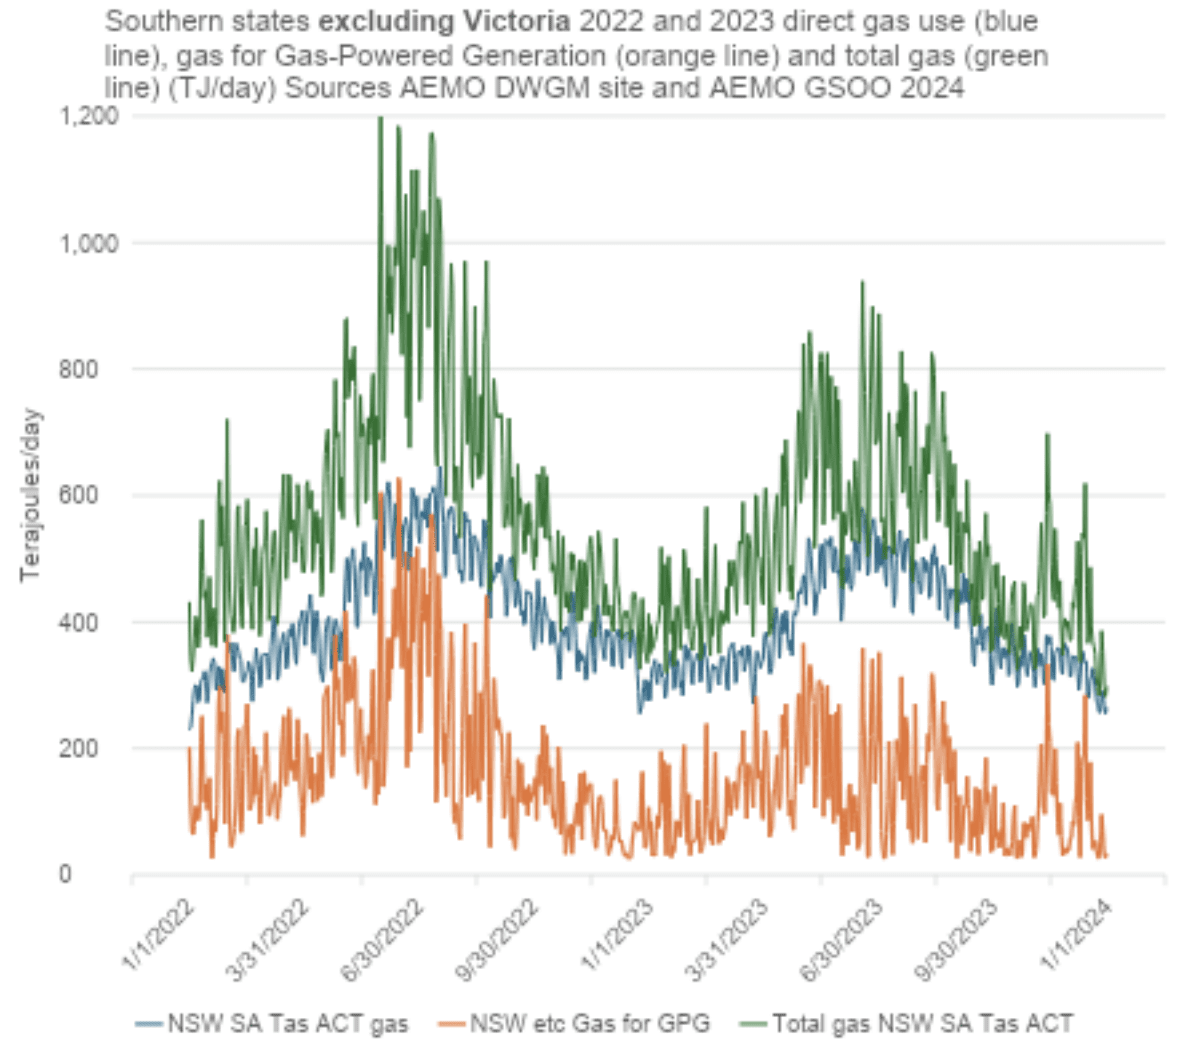
Spot electricity prices can be very high at these times, driven by bidding by dispatchable sources including gas and hydro generators and batteries controlled by market participants. These are the days when southern Australia, not just Victoria, faces emerging gas shortages. The graph below shows that NSW and South Australian winter direct gas use and gas use for electricity generation are much higher in winter.
Even though gas-fired electricity may seem to be a small proportion of electricity supply, gas generators are only around 35 percent efficient, so they can consume quite a big proportion of daily gas consumption.
Many PV systems have detailed monitoring: energy market operators and policies need to access this to make the ‘invisible’ PV generation visible. This will help analysis of both electricity and gas, interactions between them, and drive improvement in policy design.
Governments and the electricity industry need to focus much more attention on reducing winter peak day gas and electricity consumption to limit direct gas use and demand for gas-fired electricity. Strong action will cut energy bills and spot electricity market prices as well as reducing heathcare costs and improving comfort. That requires some new measures.
High winter peak day gas and electricity consumers must be targeted for help to cut their energy use. My understanding is that 5 percent of households use around 15 percent of electricity and gas.
The Frontier Economics survey of household energy bills from 2020 (see graphic below) shows that some households have enormous energy bills in winter. Many probably face financial stress and reduce heating which undermines health and may increase family violence.
Only energy retailers know exactly who and where these high household and business consumers are, but this information is confidential and they have no incentive to help them to cut their usage. State government legislation controls retailers, so they must act to incentivise or require retailers to act aggressively to identify and help them to cut both gas and electricity consumption in cold weather. Energy retailer obligation schemes provide a precedent for state level regulatory action, and could help to fund change.
Even basic monthly gas bills can provide some insights into timing of high gas use, while high frequency electricity data is widely available.
Maybe it’s time to re-introduce utility business efficiency advisory and demonstration centres like those that Victoria’s Gas and Fuel Corporation and State Electricity Commission used to run.
Policy makers and governments need to realise that a fundamental driver of our gas and electricity supply problems is inefficient energy use – and weather.
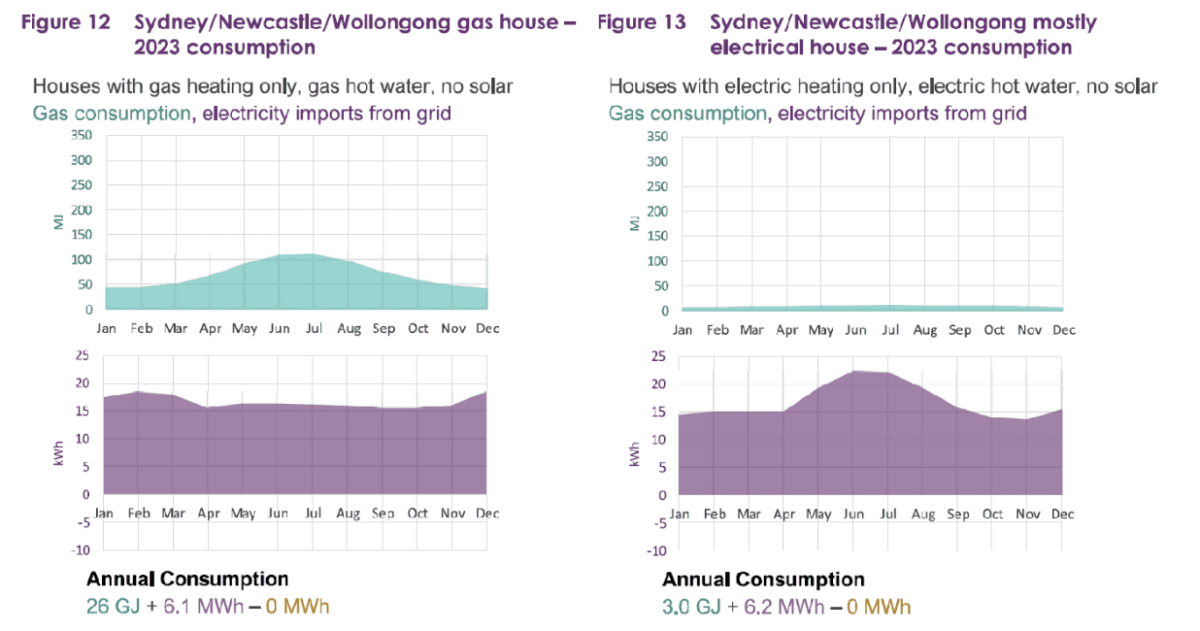
Seasonal household electricity and gas consumption based on a large sample of meter readings Source: https://aemo.com.au/energy-systems/electricity/national-electricity-market-nem/nem-forecasting-and-planning/forecasting-and-planning-data/gas-electricity-meter-data-linking-project
These graphs show typical residential consumption of gas or electricity in winter is significantly higher than the rest of the year, even in coastal NSW regions. The source report shows data for a range of other locations and for homes with rooftop solar and various combinations of heating, hot water, cooking and rooftop solar.
Examples of surveyed billing data from appendices of Frontier Economics 2020 report for Australian Energy Regulator. The climate zones are those used by the National Construction Code. Zones 6 and 7 are the colder zones. Black bars are the ‘typical’ energy usage values published on energy bills. This survey has not been repeated since 2020.
New South Wales, South Australian (and small contribution from Tasmania) direct gas consumption and gas used to generate electricity – daily consumption derived by deducting Victorian data (which is separately reported by AEMO) from southern states consumption AEMO data. AEMO does not separately report state level gas and gas supplied for gas-powered generation for NSW, SA or Tasmania. It is likely that 2022 was a colder winter than 2023.
For comparison, Victorian winter peak day gas demand is around 1100 TJ/day, and is peakier than other states due to the high use of both direct gas and gas for gas powered generation in winter.
Renewables met more than 80 per cent of total grid demand for first time on…
A new Consumer Energy Resources Technical Code will define the standards and capabilities required of…
Australian businesses looking to ditch gas and diesel can do the sums, find electrification will…
An abundance of rooftop solar generation has helped set a new record high for the…
Windlab's John Martin on the project that broke the investment drought for big wind, and…
Federal Labor's determination to power new data centres with renewables, and to minimise emissions and…