It was a while ago, but I remember the time that NSW solved the problems of late trains by changing the definition of late. It didn’t make our lives as commuters any easier, but hey: it did result in fewer late trains. Our problem was not solved, Their problem was.
When it comes to the threat of climate change, the same thinking applies: the perception of success is far more important than actual success. It is profoundly dangerous to those of us on the receiving end of the unsolved problem. For climate change, when you cook the books, you end up cooked way worse than the books ever were.
The previous conservative government had a characteristic addiction to climate action performed through the power of imagination, rather than physical changes to reality.
When Australia’s government flipped from the climate-delaying conservatives to the “centre-left” Labor government, a new era was promised. But the latest emissions data make it clear that the same instinct abounds. The same instinct: change the definition of ‘late’. Except this time, it’s worse than it ever was before.
There are a few broad categories of greenhouse gas accounting. The first is fossil carbon: dug up from deep underground and burned for fuel. Not just carbon dioxide, but methane gas and others. The vast majority of warming relates to this category. The second is the flux of carbon flowing in and out of the atmosphere, oceans, and land-based vegetation. This, you might know as the ‘carbon cycle’. When people change how land sucks up or releases carbon, that is ‘land use change’.
Smooshing these categories together as if they’re interchangeable is a primary conduit of shenanigans. This is because the fundamental nature of what land-use measurements are trying to do is extremely different to the fossil carbon stuff.
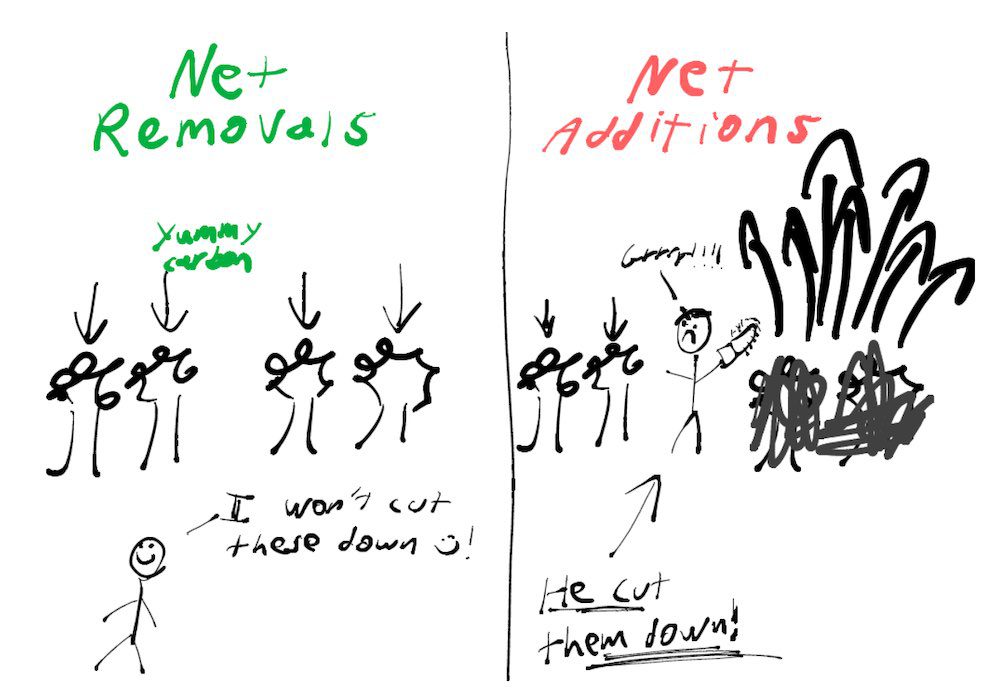
Okay, I need to explain this. Say you’ve got four trees, all breathing in a little bit of carbon each year: that’s a net removal from the atmosphere, and the “land use, land use change and forestry” (LULUCF) value will be negative. Say the next year, you cut down two, and burn them both. The two still standing still suck a bit from the air, but there was carbon in the bodies of the trees you cut down and burned, plus the soil they were planted in will also now belch carbon into the air.
That means the net change is actually carbon being released into the atmosphere: this is when LULUCF shows a ‘positive’ value.
I spoke with a few kind land scientists, and they tend to reply with an almost ashamed “It’s complicated” when I demand a simple answer.
But what I can derive is this: this sector is about measuring what happens when carbon moves from a lump of biological stuff into the atmosphere, or when it moves from the atmosphere into a lump of biological stuff – and in both cases, only when a human caused the movement. When it comes to climate, this is a very important thing to measure because ultimately it impacts how much carbon sits in the sky, trapping heat.
I have made a scientific diagram for you:
There are many ways to define human influence. Trees can regrow entirely, partly or totally unrelated to a human decision. When an emissions account says that a lump of coal was burned in a fossil fuelled power station, there isn’t much chance that it was actually just a natural process instead.
There are also many ways to measure how much carbon moves from biological stuff into the sky. If you cut down a tree, some of it may become an Ikea desk which stores carbon, and some of it may rot or burn. Who is in charge of tracking the ultimate final resting place of the carbon inside the tree that got chopped down? How fuzzy or accurate are the estimates?
Trust me when I say that the science here is completely inaccessible and utterly incomprehensible, even to someone with a data background and experience with emissions accounting.
As you can imagine, it’s an understandably tough thing to estimate. There are many trees, blades of grass, bushes, clumps of soil and other things that like to breathe in carbon dioxide, in Australia, and plenty of them get cut down, and rot, burn or regrow, for a mix of human and non-human reasons. There are caveats, exceptions and complications at every single step of the way. Revisions and methodology updates are to be expected, and are inarguably a good thing, because knowing what is happening with human land impacts is important.
But the process of creating these estimates does not occur in a vacuum: these decisions happen in the deep political context of the pressures of fossil fuel protectionism, government reputation and looming elections.
You and I: we are both utterly incapable of reviewing how human intervention and the flow of carbon get calculated. But even though we are non-experts, we still have to ask: How large are the revisions? And in what direction do they go? I can help you with that.
Back in 2019, my friend (and fellow energy / climate writer) Michael Mazengarb noticed that a new release of emissions data from the Australian government had revised its historical data for emissions in one particular category: land use.
What Michael inspired me to do then was gather up every single quarter of reported data for land-use in Australia, and visualise the volume of change made for the previous four years, which I posted in a thread.
Each quarter for the past four and a half years, I’ve added the new data into a file to see how the historical record of Australia’s land-use emissions keeps changing, and written about this issue where I can. I’ve now compiled 37 quarter’s worth of emissions reports, covering a ten year time span.
A few others have noticed this issue, and written about it: Adam Morton, Guardian journalist, Tim Baxter (another climate friend), and of course Michael, among others. It’s not unknown, but it largely hasn’t been raised more broadly.
The good people at Climate Action Tracker raised the data revisions in a post earlier this year, which climate scientist Bill Hare expanded on in a piece published on a few days ago. As Bill says:
“Every time the government recalculates how much carbon the land use sector is storing, the less work it has to do on actually cutting emissions from fossil fuels and industry sectors. That means it only needs emissions from fossil fuel use, industry, agriculture and waste to fall 24% by 2030, rather than 32%. These changes to land use accounting may sound arcane, but they have very real consequences”
Every time the land use data get revised, that allows for Origin Energy to prolong another coal plant’s lifespan, or for Toyota to sell another ten-thousand luxury road tanks, or for politicians to catch another private jet to their climate policy announcement.
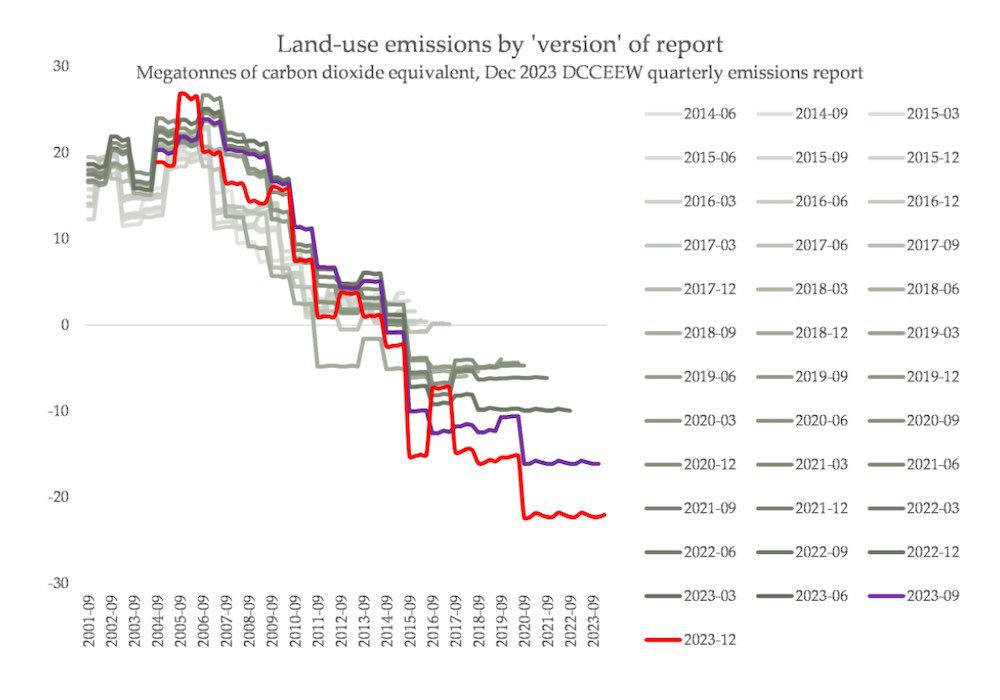
Annoyingly for Bill, only hours after that piece went live, the Australian government published an entirely new emissions report. I added the file to my collection. The results are really astonishing:
From what I can see, in the time it took to publish the PDF, emissions from Australia’s land use sector dropped about 6 MTCO2-e per quarter for the past three years. It seems to be the most significant downwards revision of recent history of emissions data ever.
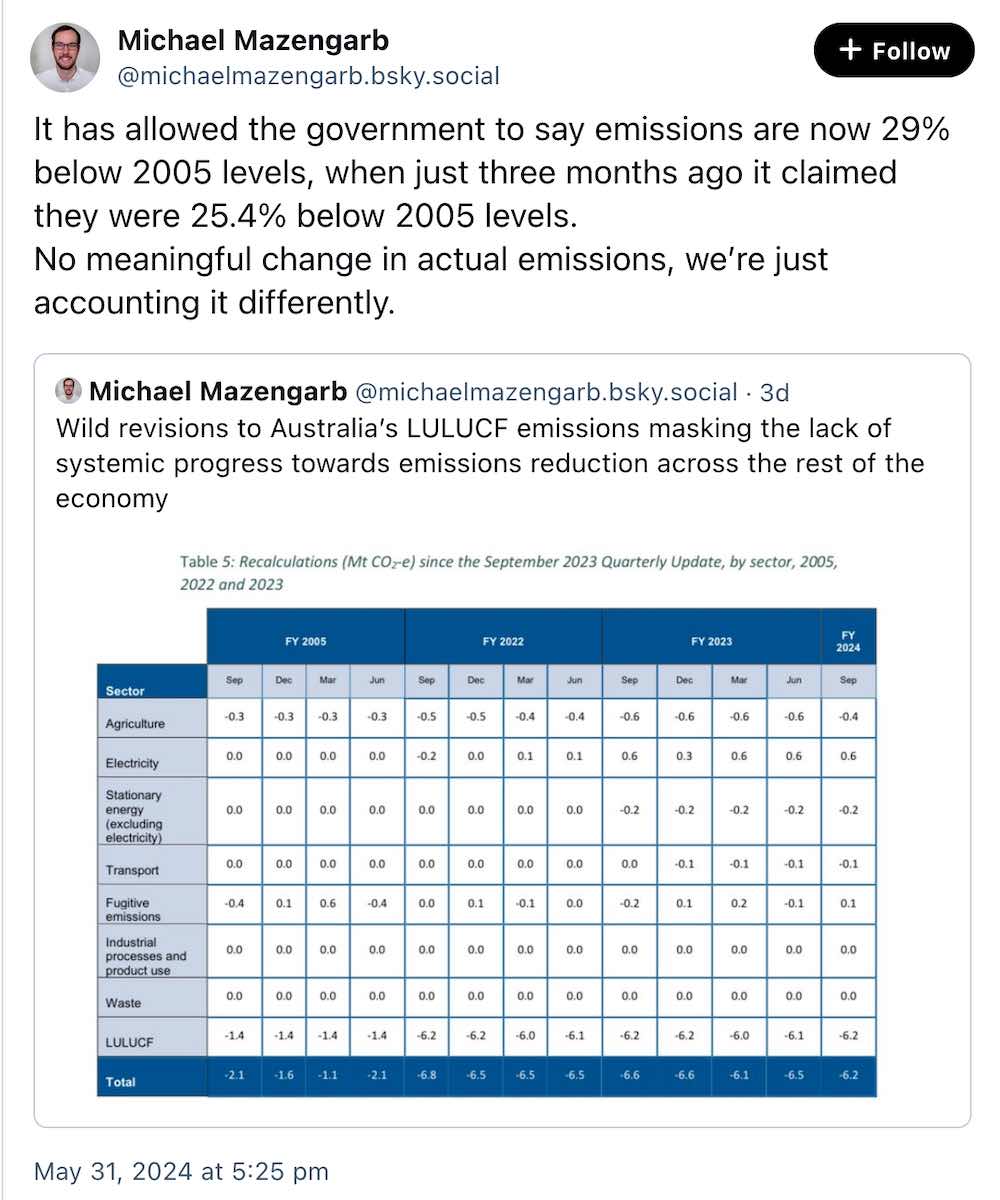
Other sectors in Australia have seen data revisions, but none of them quite as absurdly massive as land use. To compare revisions made to the other major emitting sectors in Australia:
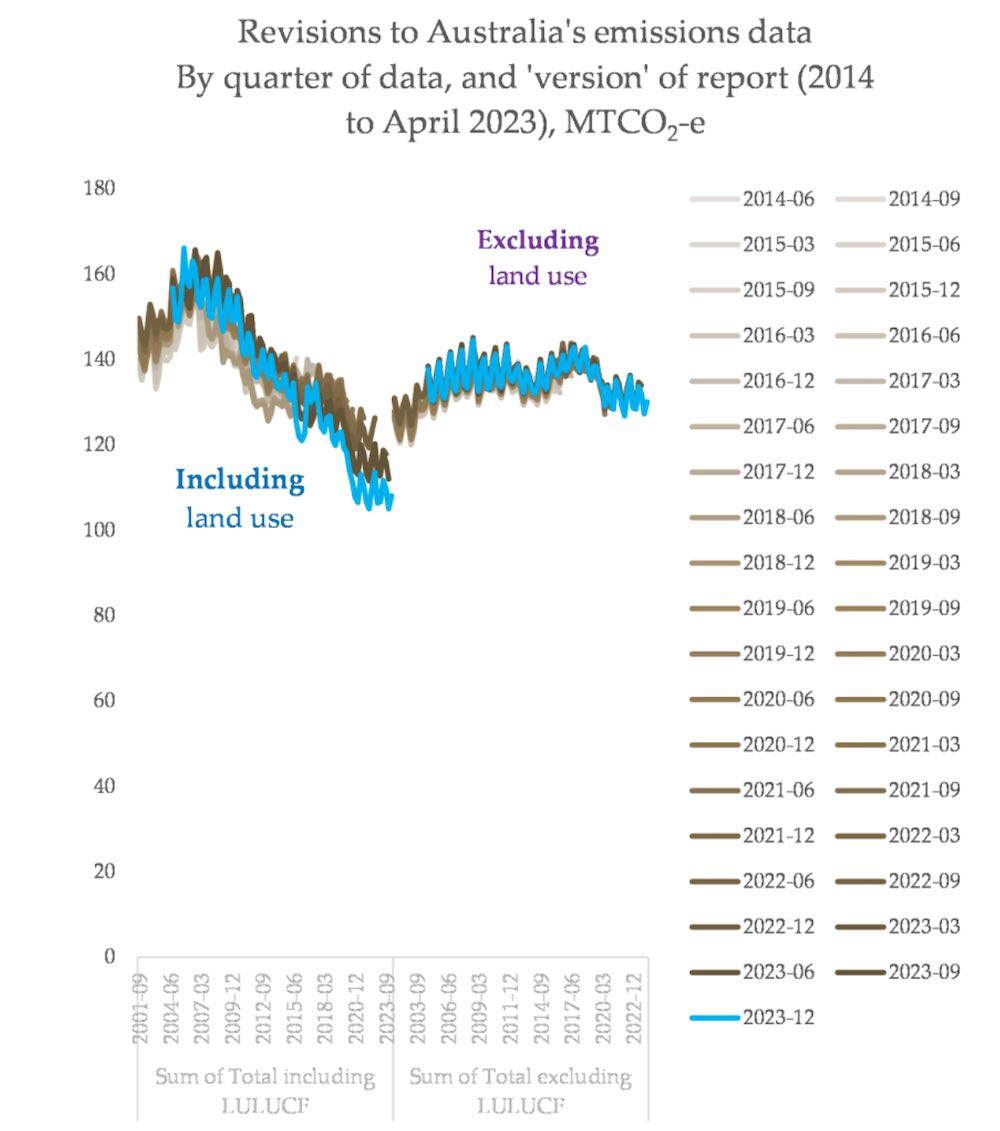
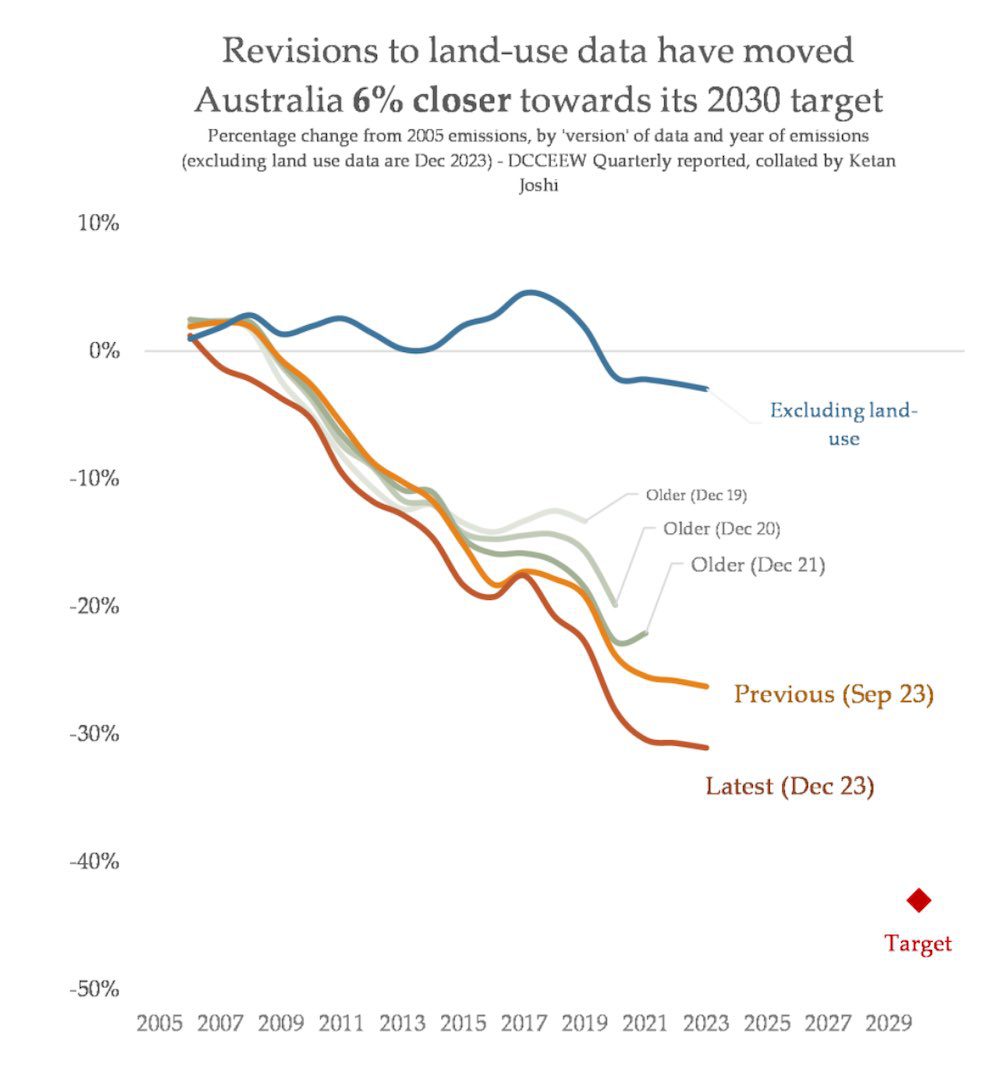
Add up all the sectors, and you can see how the entire story of Australia’s emissions reductions from 2005 hinge on land use being revised upwards in the past, and downwards in recent years, making everything steeper. If you exclude land use data, you can see there has been some change from 2005, but not much. If you are a politician, you know immediately which picture you’d prefer to be painted by your environment department:
As I noted in this piece for RenewEconomy in 2021, in addition to shifting recent emissions downwards, Australia has also been shifting emissions in its ‘base year’, 2005, upwards. This is the year the 2030 target is based on, and when you revise that year’s emissions upwards, the target emissions also get revised upwards.
You can see how this is a sort of pincer movement of adjustments: base year goes up to weaken the target, and recent years go down, to further narrow the gap of reductions required.
The end result from these ongoing adjustments to 2005’s emissions is around 15.6 MTCO2-e extra emissions that can be released in the year 2030, roughly equivalent to keeping one of the country’s biggest coal plants open. How lovely.
And how gloriously auspicious that every revision to Australia’s emissions accounting method results in the numbers tilting specifically up in the base year, and tilting specifically down in recent years.
Michael pointed out something important, with regards to this gargantuan revision:
I get a slightly more dramatic outcome from my spreadsheet: the percentage reduction from 2005 to 2023 changes from a 25% reduction to a 31% reduction, based on the data revision. Again, this has been happening for a while, but this is a brazen escalation and the most narratively favourable revision ever.
Emissions for 2023 were revised downwards by 26 entire megatonnes.
By revising land-use data, the Albanese government has achieved the same magnitude of change as the past five whole years of actual emissions reductions in Australia’s entire power sector. That’s three extra gigawatts of wind power and about six extra gigawatts of solar (together about $30bn AUD of investment).
Half a decade of deployment of real wind turbines and solar panels: blood, sweat, tears, metal, glass, cement and wires, repeated again in the seconds it took the PDF to go from prod to live on the government servers.
Previous quarterly emissions reports have muttered their way around major revisions to data, usually with a few brief sentences. This edition has an entire essay, complete with a body and a conclusion, justifying the changes. I would describe it as kind of terse and pre-emptively aggrieved.
“Today’s national inventory system is the product of continuous innovation and early adoption of emerging international techniques to measure, estimate and verify greenhouse gas emissions over the approximately 30 years of emissions inventory compilation. It is a key reason why Australia’s greenhouse gas emissions inventory is considered world class”
Truly: what does ‘world class’ mean, when land-use data gets breezily revised every year to the magnitude of deleting entire coal-fired power stations or adding a half-decade’s worth of clean energy?
The environment department claims Australia’s methodology was reviewed by the UNFCCC, but the review seems to be a “simplified review”, and it doesn’t make its conclusions clear. Is this a scientific review of the methods? It doesn’t look like it, but you probably need to be a dedicated professional expert in this precise field to even begin to know. Whatever that review was, it’s not clear or transparent, and it doesn’t answer key questions.
Most of the largest revisions in last week’s update are pinned to croplands and grasslands, and specifically increasing the sensitivity of their model to rainfall. This makes crops and grass grow more, which leads to more carbon being sucked into the soil – and hence, lower land use numbers in the new method. Heavy rainfall periods – ie, the past few years – see more carbon sucked into soil. The millenium drought saw little rainfall; hence minor upwards revisions.
That every single revision over ten years has had the direct result of causing a decrease in the amount of effort needed in fossil sectors is, they would probably say, a total coincidence.
“In accordance with Paris Agreement rules, improvements are applied across the full time series where appropriate to ensure consistency and comparability. The practice of annual inventory revision is common to all reporting parties and reflected in Nationally Determined Contributions.
This is all very hard to fact check. You simply need to be a dedicated, full-time expert in the accounting systems here to even begin assessing whether the claims are true, and the changes valid. Each of these changes could be driven by raw, unbiased hardcore science, and it could just be pure luck that every single update has the result of allowing millions of tonnes of extra emissions from the country’s fossil fuel burning to still achieve targets. From what I can see, no one has really checked.
I would bet that this is simply a matter of picking which changes to make, and which to ignore, within the extremely complex, fuzzy and malleable world of accounting for human land impacts. A conspiracy of selectiveness, obscured in complexity. When I first raised this in 2019, I was extremely careful not to imply any intentional shenanigans. Five years of massive data revisions each favouring the incumbent government later, we can say there’s a high chance there is something going on here.
What we can say for sure is that it is not weird at all to see huge, eye-watering recalculations of land-use inventories. As CICERO climate scientist Glen Peters points out, the whole world’s land-use emissions estimates vary wildly over the years. Land use data is inherently unreliable and flexible.
Climate Action Tracker point out this is advantageous for governments wanting to take the easy road on climate:
“The large data uncertainty—and possible fluctuation—of emissions from LULUCF really put these emissions in a different category. Combining both in one aggregate target would also impose these uncertainties on the other sectors……the estimation of uncertainties in the LUUCF sector gives governments freedom on the calculation approaches, which then also has an effect on whether emission targets of the other sectors are met”
Problematically, the EU is looking to include land use data in its emissions accounting and climate targets. Glen Peters points out that it could bite back: if forests become a ‘source’ of carbon, ie if the carbon in the trees and soils gets released, it’ll make achieving targets harder, not easier. It’s not quite as bad as Australia, but including LULUCF shaves a few percentage points off the required fossil fuel cuts.
Recently, a group of academics, experts and activists called on the EU to set completely separate targets for fossil emissions and land use. “Net targets treat carbon sequestration in the land sector and permanent removals as substitutes for emissions reductions. This risks so-called “mitigation deterrence”, i.e. emission cuts being delayed or replaced by current or promised future removals or sequestration”. The EU has at least set an absolute limit of how much can be claimed in this sector.
There is something else worth noting here: while continuously updating land-use methods and miraculously receiving favourable outcomes each time, Australia has been slow-walking updates to how it measures methane emissions.
There has been a slew of recent reports essentially confirming that Australia wildly understates the methane emissions from coal and gas mining projects – already one of the core drivers of the country’s emissions.
What hasn’t happened is a major upwards revision of Australia’s emissions data to reflect that. For climate, there are a lot of things the government doesn’t want to do, but also can’t be seen not doing. For these, they simply promise to do it and then perform that in the slowest motion imaginable.
The simple solution here is that land use data needs to be excised from all reporting of Australia’s emissions. Journalists, activists, industries and academics should at the very least only ever include land use as a separate line, if at all. The sheer unreliability of the sector’s data totally disqualifies it from being considered (let alone the fact that absorption of carbon into vegetation isn’t truly an undoing of its release from deep underground).
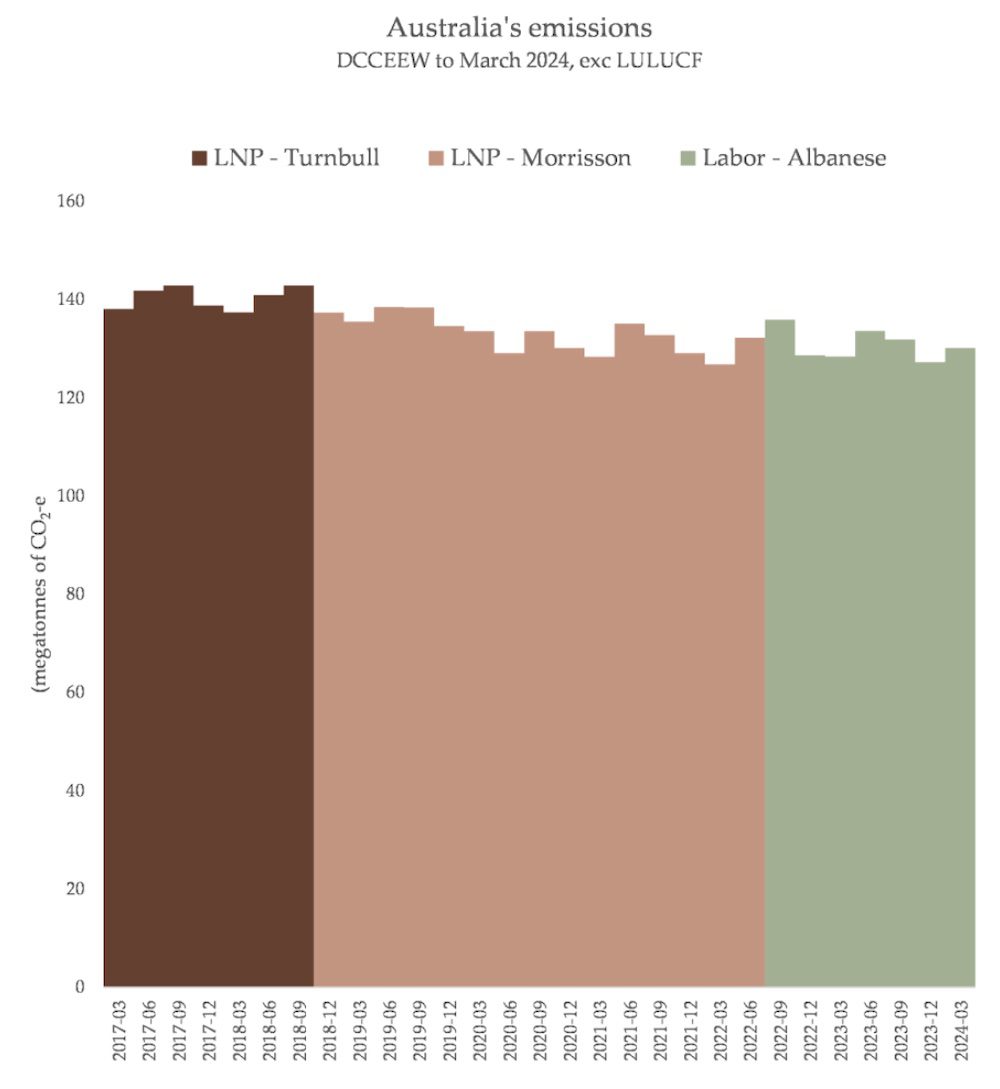
If the Australian government were serious about trains running on time rather than changing the definition of late, they should do the same on its official accounts. It almost certainly won’t. But everyone outside of it is absolutely free to only talk about the bulk of the problem: Australia’s fossil carbon emissions, which have been stagnant for decades.
As you can see above, Australia’s emissions have only fallen a few percent since 2005. Maybe more importantly, Australia’s emissions have barely fallen at all since the election of Anthony Albanese in 2022.
The power sector is probably the most worrying thing, in this report.
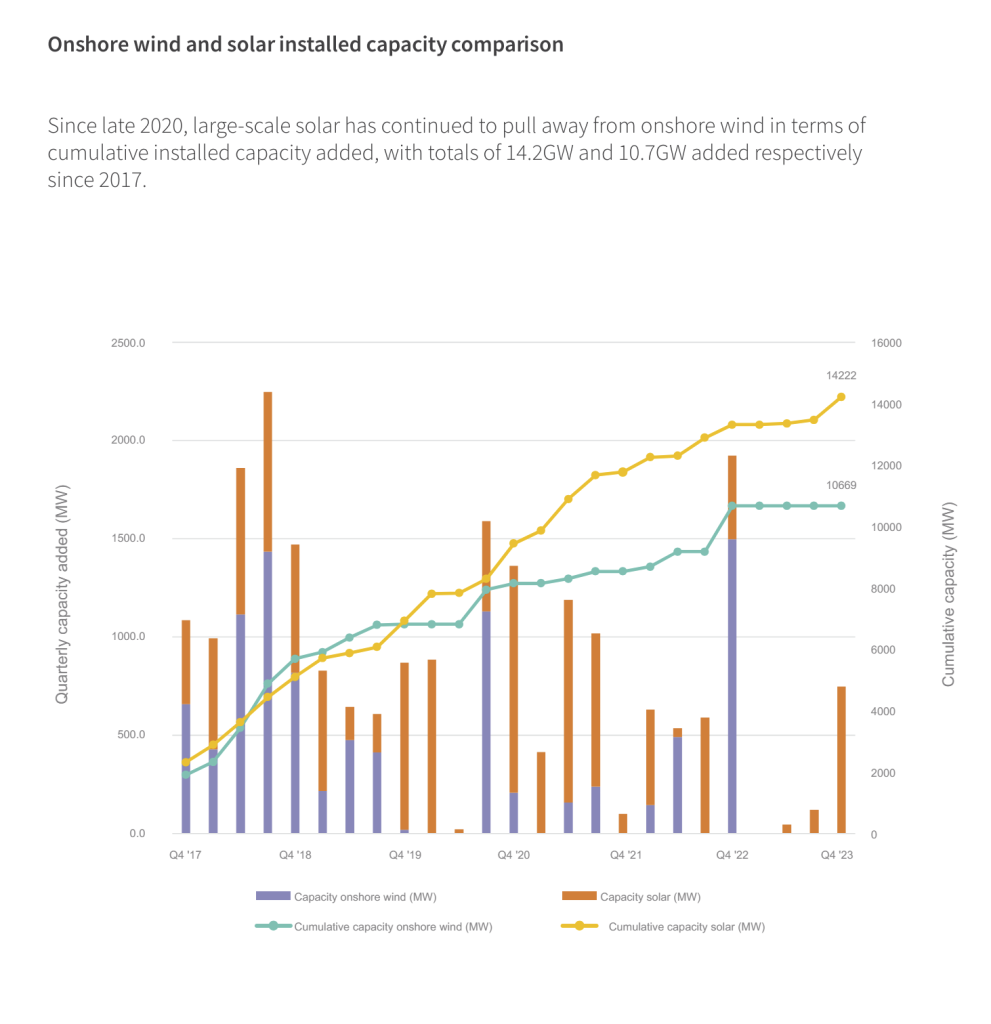
The Labor party‘s supporters point out that new renewable energy is causing reductions, and it’s true: but the rate of those reductions seems to be slowing down after the RET boom, and if the trend continues, Australia’s power sector could switch to stagnating or even rising emissions. In fact, the first quarter of 2024 saw the highest rise in emissions from the same quarter in the previous year since 2017:
For the first time in a decade, since the Abbott years, Australia’s coal-fired power stations have seen a steady increase in their output. Even though there is new renewable energy coming online, it’s not enough to keep up with demand, which is also rising for the first time in a long time in Australia.
I noticed a slowdown in new renewable energy back in 2021 and warned against complacency, arguing the likely incoming new government at the time should extend the renewable energy target at the very least, in addition to preparing for rising backlash to corporate developers of wind, solar and transmission lines. The best time to have done that would have been two years ago, but the second best time is right now.
The latest update on new clean power projects in Australia is bleak but absolutely reversible if the Labor party commits to going beyond their ‘capacity investment scheme’ and directly incentivising a much larger deployment of solar and wind in particular (the move away from wind power and towards a solar-exclusive development mode in Australia is, I would bet, likely to be contributing to more fossil fuels being burned than should be).
The decision of the NSW Labor party to extend the lifespan of Australia’s biggest, most polluting coal plant will chew through at least a few percent of the country’s entire emissions budget to 2030 (and NSW taxpayers will be paying a fossil fuel company for the privilege of up to four more years of mercury and air pollution). Everything bad we see here will get noticeably worse.
Two core things need to work for emissions to fall faster: more clean energy, paired with the planned, controlled shutdown of coal-fired power stations.
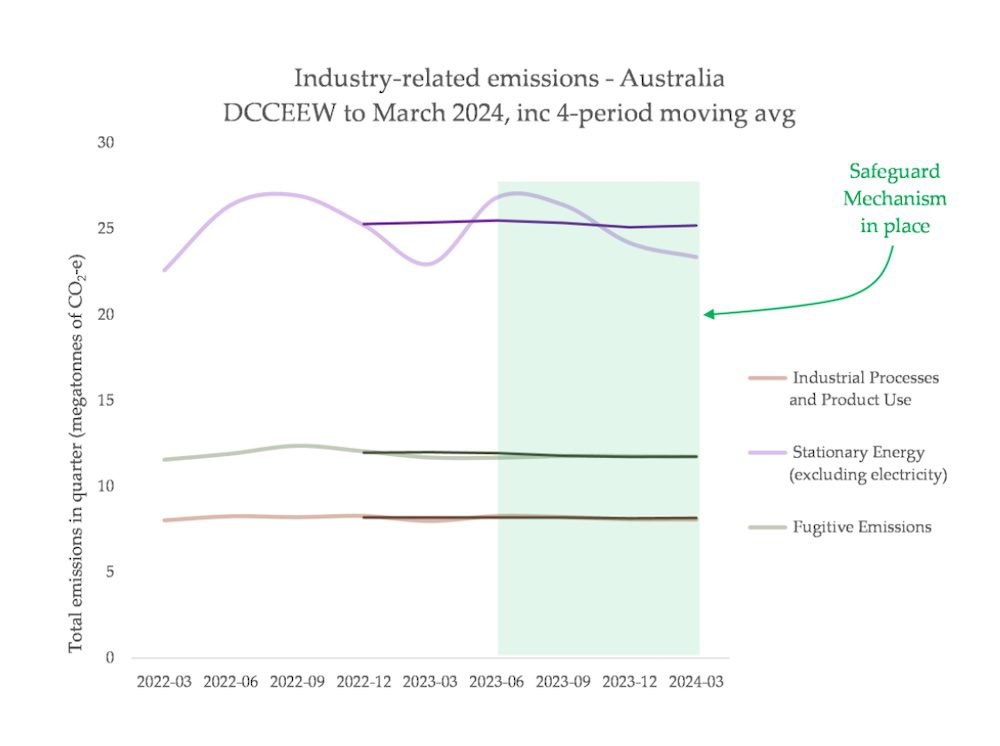
In the industrial / fossil fuel mining sectors, the ‘Safeguard mechanism’, a mandatory carbon offsetting scheme, is likely having almost zero impact on the worst emitters (it’ll be another three quarters of a year before better data come out, but this gives us a rough idea for now):
In transport, emissions continue to rise post-COVID, and the report points out that rising sales of SUVs are a major component, which is not surprising. I recently wrote here about how the new fuel standards will decrease emissions incredibly slowly, thanks to the carve outs it has for oversized vehicles: the primary cause of rising emissions in Australia, and in the transport sector globally.
Fossil gas mining continues to be a major source of domestic emissions, because to dig up gas you need to burn it and dump it in raw methane form into the atmosphere and the huge array of planned gas projects in Australia will make this trend even worse. Agriculture emissions have risen due to larger stock sizes, helped by the wet recent years, but may stabilise soon.
What little good news there was in Australia’s emissions accounts is clearly wavering, less than 12 months from the next federal election. You can see how why finding a way to drape a cover of this picture is such an urgent priority, for the government.
Measured emissions from fossil carbon cannot be contaminated with land use data. The data revisions and methodology shifts are huge and totally wild. The justifications for these revisions are inaccessible and opaque. Every single revision seems to have an outcome that directly benefits fossil fuel industries, along with captured political parties keen to feign “achievement” of targets.
It is important to get right, but right now it is so consistently wrong that it has become one of the most powerful engines of climate delay there is.
Thank you Hisham Zerriffi and Richard Waite for helping me understand land-use stuff, on Bluesky.
Article originally published on ketanjoshi.co. Reproduced with kind permission of the author.
We are so focused on building new transmission superhighways that we’re ignoring the smaller stuff…
Australian solar innovator powers up a demonstration of its unique technology using concentrated solar to…
How balcony solar is reshaping household energy use in Germany.
A group of international researchers are touting a “dream technology” that could supercharge solar energy…
Australia setting battery records across the market as home energy rebate passes a new milestone…
Peak demand is expected to double over the next decade as industries flock to take…