South Australia is often demonised as a flagship of failure in the push to renewable energy, it is the convenient whipping horse of anyone – from the prime minister down – looking for arguments to either stop the transition to clean energy in its tracks, or to slow it down completely.
Energy minister Angus Taylor is fond of saying that there is too much wind and solar in the grid. But as convenient and glib as it might be to seek to make fun of South Australia, usually with reference to the catastrophic system black in September 2016, and the load-shedding the following February, the facts say something else entirely.
Simon Holmes a Court, from the Climate and Energy College, gave a key-note presentation to the Smart Energy Conference in Sydney on Tuesday that punctured many of the principal myths around South Australia – namely that the shift tor renewables in that state has caused prices to rise, destroyed reliability, and hasn’t done much on emissions.
So here’s a bunch of graphs to prove how wrong that is.
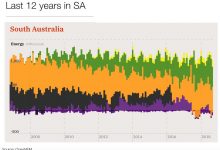
The first, at the top, shows the significant transition in the South Australian grid over the last 10 years. Coal disappeared by 2016, largely replaced by wind, the amount of gas generation that is used has reduced, largely displaced by rooftop solar and the emerging large scale solar. And the reliance on imports is now reduced – the state is now more likely to be exporting rather than importing.
And what has this delivered? As this next table highlights it has delivered cleaner power, the biggest drop in emissions in the main grid, the biggest reduction in emissions intensity and as an added bonus – lower prices.

It is often forgotten that South Australia always had the highest prices in the main grid, mostly because it was a small market dominated by expensive gas generation and incredibly dirty coal generation. South Australia’s wholesale prices are still higher than other states, because gas still sets the price much of the time, but the difference is now less marked, and narrowing.
As former prime minister Malcolm Turnbull noted at the same conference, renewables are now so cheap that they can deliver both price falls and emission cuts. And South Australia has certainly delivered that, with dramatic falls in energy emissions, both in aggregate terms and in emissions intensity. What’s not to like?
 This next graph is an interesting one too. It’s a variation of the very top one, but rather than defining the energy sources in their normal terms – wind, solar, gas or coal – is uses variable, fast flexible, slow flexible, and imports and exports.
As you can see, South Australia has a lot of variable energy. This requires people to think differently about the grid, not relying on the old caseload-peaking generators of old, but to grab the cheapest source of power and fill in the gaps.
South Australia still has some slow flexible, in the form of combined cycle generators like Pelican Point, but the greatest share of “flexibility” is not shifting to “fast flexible”.
Ah, but South Australia is dependent on Victoria coal to keep the lights on when the sun don’t shine and the wind don’t blow. Not so much, these graphs above give a bit of a hint, but here is the table below that shows South Australia is the second biggest exporter of electricity in the grid.
It seems this is a surprise to even our energy ministers, including Don Harwin from NSW who insisted that NSW was not a big importer. This graph shows that it is the only net importer, and by a considerable margin.
That is something to think about for a state that imports so much, and faces the closure of many of its coal fired generators over the coming decade, and is doing comparatively little to build new generation.

And that takes us to the question of reliability.
Remember those blackouts and outages that caused all the furore and the labelling of South Australia as a bad example to follow. The system black, it is now clear, was caused by catastrophic and cyclonic winds that pulled down three main transmission lines, and there was no fall back situation.
 The outages suffered because of a lack of supply tell a different story. South Australia, in February 2017 suffered a widely reported outage when one of the units at the Pelican Point gas generator sat idle, and the situation was made worse by mistakes by the local network operator that trebled the number of people affected.
In NSW, the impact two days later in the same heat wave was a lot worse. And this in a state dependent on coal and gas – it was many of those generators that let the grid down.
Finally, here is a dynamic chart prepared by the Climate and Energy College team showing the changes in load in South Australia over the last seven years, the infamous “duck curve’ that presents issues in managing the grid, but can probably be handled with some thoughtful planning, some storage, and some demand management.