“Hello, I love you, won’t you tell me your name”
The Doors, 1967
Baseload electricity prices in Australia are in the middle of the global pack. But where will they be in ten years time?
Because electricity prices in Australia have risen, and because business tells us so, we tend to assume that our electricity prices are expensive by global standards.
However, at the generator level it’s not as bad as all that. For households, the fundamental reason to expect Australian electricity to be expensive relative to the rest of the world is dear old Geoffrey Blainey’s “tyranny of distance”.
That’s because historically we have chosen to live mostly in detached houses with big back yards, or even in the country; it takes a lot of wires and poles to connect everything to the grid.
And it seems to take a lot of open (operating expenditure) to keep those wires and poles functioning. Lots of management overhead, lots of vegetation management etc etc.
And in some States the generation is a long way from the consumption and that requires lots of transmission. Australia has the longest interconnected transmission grid in the world, but it still doesn’t get to West Australia or the Northern Territory.
So per unit of consumption distribution and transmission charges are expensive relative to more densely populated regions of the world.
For industrial users though this doesn’t matter so much. The table below is constructed from AGL H1 2018 results.

Business customers pay about half what households and small businesses pay. Most of the difference is because business tends to consume electricity at higher voltage than households and so it pays a much smaller amount of network costs.
A small part of the difference is due to the different load shapes of the consumers versus businesses. In general, business has to have a flatter or even a flat load. The famous “baseload”.
Households have peak and offpeak consumption and the peak requires peaking generators which have to be paid for. Even so, load shape is probably not worth more than $30/MWh.
In the new world it may even be that a flat load will be more expensive than a peak load. Peak loads can generally be modified by demand response, but flat loads by definition are 24/7.
Let’s put that to one side, the bigger point for this note is that at the generation “bus bar”, where the generator connects to the grid electrons are mostly electrons and the generator doesn’t know whether they are going to consumers or businesses.
So if we are interested in controllable global electricity costs its arguably more useful to look at generation prices and not to count wires and poles costs.
There is a further debate to be had about renewable subsides or environmental taxes, but we are going to overlook or ignore these in this note. Environmental taxes are important today and are going to be far more important in ten years, but they are more work to track down.
Again a proper study would ensure that time periods were consistent, but equally proper studies take a lot of work. Casual empiricism is our daily diet dear readers.
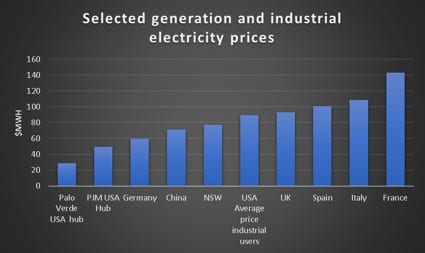
The following chart is missing a lot of numbers. It doesn’t have Russia or the Middle East (low industrial electricity form cheap gas). It doesn’t have Canada (cheap hydro power but little or no expansion) and it doesn’t have Japan (likely expensive as it reliess on imported coal and gas).
It does show that the USA is cheap but Australia, using NSW as a surrogate, is not, at the moment, super out of line. However, things change quickly. The European prices were in December 2017.

In particular we’d observe that China is close to Australia. Looking at China for just a bit….
China
Thanks to some investment banking research we can see the calendar 2017 results of some of the major independent power producers [IPP] in China. The table below shows two

These guys between them have 78 GW of coal fired electricity, but on average it only runs half the time, so despite its low capital cost its really not that much more profitable than an Australian coal generator.
However the key point is the coal generation in China was receiving about AUD $72/MWh about exactly what a coal generator in QLD would get, but on much higher capacity utilization.
Further than that the coal generator in China is paying, if I have done my casual empiricist sums right, about A$115 per tonne of coal. You have to convert “standard” coal to “ordinary” coal, and RMB to AUD.
Alternatively you can ring up your favorite global investment bank ask nicely and they might do it for you. And then look at the wind capacity factors not much over 20% for say an A$80 MWh -$90 MWh price. On this basis getting $A50 MWh for a 40% capacity factor in Victoria might not look so bad: hello Goldwind.
Huadian’s ROIC is about 5% in a good year. CR apparently might get a ROIC of 6%-7%
Looking forwad in CHINA
The key variable, in our view, in thinking about electricity in China is capacity utilization. Supply of renewables is still booming, 1 GW a week of PV last year even if some is constrained off the grid.
There is less but still some new coal generation and new wind. Actually even in China transmission remains a big deal. China State Grid is probably the biggest electricity organization in the world but its opaque.
Although its building 3 new 800-1000 KV UHVDC transmission lines to help curtailment rates for wind from North West China that reach 30%, its not clear to me that just those lines will be enough.
Bob Burton has already written about Boom and bust 2018 but anyone interest in following the global coal fired electricity industry development should make it their business to read this excellent report.
Even the AFR’s Matt Stephens has felt compelled to comment. In any event we reproduce two charts from this report and construct one of our own from the data. I would argue that in its own way this report is as good as anything produced by say BP, or the IEA in terms of analysis.

New plant built is running at about 2- 2.5 times the level of retirements. Retirements have accelerated from about 15 Gw a year in say 2010 to around 25-30 GW in 2017. The Boom and Bust report states Steven Davis and Robert Socolow note the median retirement age of coal fired plant at 37 years.
However, we would caution that historic averages may not mean that much in a world of changing technology and higher emission costs.
The chart below of global coal plant by age and region, is better than those we have previously published because it includes China and India.

Finally, to put China’s coal fired electricity generation in perspective:

China is building more wind and PV, probably about a combined 70 GW per year and unless electricity demand continues to grow faster than we think it will there may still be an oversupply crunch. We will return to China another time.
David Leitch is principal of ITK. He was formerly a Utility Analyst for leading investment banks over the past 30 years. The views expressed are his own. Please note our new section, Energy Markets, which will include analysis from Leitch on the energy markets and broader energy issues. And also note our live generation widget, and the APVI solar contribution.


