As we have reported here and here, Australia’s recent record on renewable energy investment has been pretty poor – hitched, as it is, to weak and unstable and policy signals.
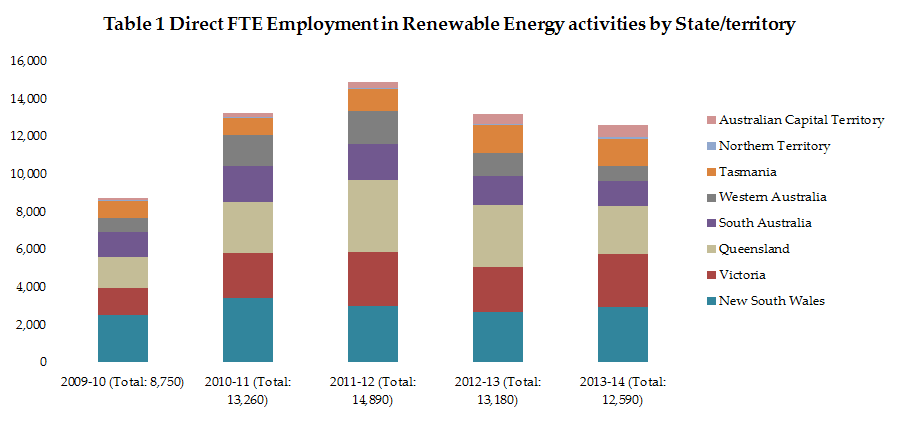
Now we can see the impact this has had on jobs, with the release this week of Australian Bureau of Statistics data on annual direct full time equivalent (FTE) employment in renewable energy activities in Australia for the years 2009-10 to 2013-14.
Also represented in a series of charts, the ABS stats show that the number of full-time jobs in renewables in Australia stood at 12,590 in 2013-14 – an increase of 3,840 or 44 per cent on the employment level of 8,750 recorded for 2009-10.
But the sheen is taken off that number when you note the decline of 2,300 – or 15 per cent – from the peak of 14,890 recorded for 2011-12, as uncertainty set in in 2013 over the Abbott government’s plans for the RET, and as both federal and conservative state governments began winding back and removing solar support mechanisms.

As the chart below indicates, employment in roof-top solar (which includes solar hot water systems) made up the largest component of total direct annual FTE employment in 2013-14 at 6,120 or 49 per cent of the total, despite the big drop you can see, from the 2011-12 peak of 74 per cent.
Wind power – which the report notes is primarily driven by installation activity, rather than ongoing operation and maintenance, and is therefore heavily dependent on continued investment – varied in size from a low of 1,110 in 2011-12 (7 per cent of annual direct FTE employment in renewable energy activities) to a high of 2,690 in 2013-14 (21 per cent of the total).
Interestingly, employment in renewable energy activities located in government entities and in non-profit institutions (NPIs) grew steadily from 480 in 2009-10 (or 5 per cent of annual direct FTE employment in renewable energy activities) to 1,170 in 2013-14 (9 per cent of the total).

State by state (the charts of which you can follow in Ketan Joshi’s Spotify story, embedded below) the profile of renewable energy jobs varies, sometimes depending on what local governments are doing. All up, however, solar jobs dominate in most states and territories, including employment in roof-top solar, solar hot water and large-scale solar.
This pattern was strongest in WA and Queensland where 89 and 88 per cent of jobs, respectively, were attributable to solar in 2013-14. Likewise, in most of the states – NSW, Victoria, South Australia, Queensland and WA – have seen big falls in solar jobs in the last couple of years.

