In an active month the LGC forward curve diverged with a stable to positive outlook for the spot to Cal 18 periods contrasted with a Cal 19 market that lost considerable ground.
It was the latter vintage that garnered the most attention and provoked the most intrigue across the month, with the commitment of a 530 MW wind farm also a headline grabber. On the regulatory front the Coalition continued to seek a solution to its emissions policy dilemmas with repeated attempts to shift the focus toward a low emissions technology target.
Some would argue that scepticism and realism are integral parts of an effective traders’ mindset, and both have been part of the spectrum of emotions experienced by those looking on to the unfolding carnage in the Cal 19 market across May.
Having closed April at the significantly reduced price of $64.50, the Cal 19 market lost further ground across May despite the stability and even recovery of the shorter end of the curve. On the back of a steady flow of activity the Cal 19 market softened persistently to breach the $60 mark by mid month and continue down to a low of $52.00 before a recovery of sorts eventually ensued.
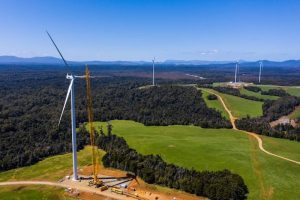
Perhaps associated with the decline was the announcement during the month of the 530MW Stockyard Hill wind farm, the largest single project commitment since the recent run of activity began last year.
On the face of it, a project commitment of this size takes a big chunk out of the required commitment effort and hence could explain why some felt the Cal 19s to be a bit weaker. Yet critics of this theory point out that at best the wind farm may contribute to half a year in Cal 19. At worst it may only contribute to Cal 20.
Short of a rock solid explanation for this dramatic decline, there are many who have wondered whether there is something they are missing. Is a spate of significant project commitments about to be announced? Is the current situation a reflection of the fact that a major penalty payment will take place in the next 2 compliance years? Will the Finkel review yield recommendations for some kind of short term regulatory change? Your guess is as good as mine goes the usual response.
Yet explaining the Cal 19 market’s fall from grace is difficult unless you believe that one or more of these seemingly improbable outcomes will actually play out. Depending on what proportion of wind versus solar is rolled out, the consensus is that at the very least another 2000MW of projects are required to contribute to the Cal 19 compliance year to give the market any chance of avoiding a shortfall.
Traditionally, wind projects have required 2 years from date of commitment to date of commissioning, leaving very little time for that technology to make an impact in Cal 19. If we assume the industry is really on song and capable of somehow reducing that down to 18 months, then wind project commitments would need to happen no later than the end of this year to manage even a 50% contribution to Cal 19.
Solar is far easier and quicker to roll out, with some projects reportedly requiring as little as 6-8 months to be fully operational. Yet to date there are few very large solar projects that appear to be at advanced stages of development. And the capacity factor of solar is considerably less than wind, meaning the greater solar’s contribution, the more projects that are required.
Based on all this there are many who believe the current situation is simply irrational and that it is not reflective of the monumental challenge that is the result of more than half a decade of missed investment. In the end though, it comes down to risk appetite and in a market where plenty of unexpected things have happened, it certainly bares some consideration.

For the spot LGC market May was a more positive affair with the market recovering from the low $78s to reach a high of $82.60 early in the month before then softening to spend the second half of May trading in the $78.50 – 79.25 range and ultimately closing at $78.90.
Trade volumes in the spot market were up across May with just under 500k reported in the over the counter market.

The Cal 18 vintage also recovered during May, trading from the high $71s to a high of $75, before then spending most of the back end of the month around $74.00 and ultimately closing at $74.20.
On the subject of the future regulatory environment, the major talking point across the month was the Turnbull Government’s focus on technology neutrality in future emissions reduction policy and the prospects for the adoption of a low emissions technology target to replace the RET as the driver of low emissions technology beyond 2020.
The approach appears to be the most palatable option available to the Turnbull Government who finds itself paralysed on the idea of an emissions intensity scheme for the electricity sector.
The Finkel Review (due in early June) is broadly expected to be consistent with its preliminary report and recommend an emissions intensity scheme as the primary mechanism to reduce emissions in the electricity sector, a position supported by virtually all stakeholders and the Labor Party.
Yet the leadership within the Coalition has been incapable of winning over the party room on the issue and instead has the embarrassing position of now opposing a policy with almost unanimous support and for which it was once a leading advocate.
A low emissions technology target is expected to be amongst the list of alternative policy mechanisms recommended by Finkel in recognition of the current political context. Late in the month the Energy Minister Josh Frydenberg also announced plans to amend the Clean Energy Finance Corporation Act to allow it to invest in carbon capture and storage.
Small-scale Technology Certificates (STCs)

The STC market continued to garner attention across May with forward market activity, growing submission rates and an ultimately rapid reduction of the Clearing House queue that brought a return to surplus considerably quicker than appeared likely.
With the Clearing House in deficit 1.4m after the Q1 compliance period, may was always going to be a slow starter in the spot market. However, activity in the forward market was solid early on with brisk trade for Q3 (Aug-Oct17) taking place around the $38.00 mark and Q4 (Nov17-Jan18) at $37.80. Q2 activity also followed with June and July short forwards trading in the $39.30-$39.40 range across most of the month.
Following a slowdown in STC submissions across April owing to public holidays and inclement weather, the numbers rebounded rapidly across May with an average weekly figure of 410k, dramatically above the weekly rate required by the 2017 target.

Perhaps the most interesting development across the month was the rate at which the Clearing House deficit reduced. Having started May at 1.4m, the first two weeks saw roughly 350k come off the deficit each week, leading many to believe it would actually be the very end of May before a surplus returned. What then followed was a single week in which the deficit plummeted over 700k, ultimately bringing seeing a surplus arise on the 23rd of May.
When the spot market did return to trade it opened sharply below where the Q2 forwards had been trading, with deals at $38.65 and $38.75. This was not to last however and within days the spot had recovered to reach a high of $39.30. From there is softened back to $39.10 and concluded the month at $39.15.
The big question now is whether or not that will be the last time the Clearing House is used in 2017. That there will be enough STCs created to meet the Q2 target of 3.1m is now more or less guaranteed. At the time of writing there were just over 1.5m STCs registered with a further 860k pending registration. Add to that 2.36m a relatively moderate weekly creation rate of say 380k per week between now and early July and the market appears set to be oversupplied by circa 1.2m STCs.
Interestingly, this does not absolutely guarantee that the Clearing House will not be used at all, as it is possible that some participants may not be able to find the STCs they require and may opt to use the Clearing House and pay $40 even though they could have bought previously at the lower market rate.
While the lure of holding out for the Clearing House may be great for some creators, such an approach brings with it significant risks. Current creation rates suggest that the Q3 compliance period will be oversupplied to the tune of 3m STCs, hence those who miss out on selling in Q2 will be carrying STCs forward to a period likely to be flush with sellers. And the forward market continues to price Q3 at the reduced rate of $38.00.
Marco Stella is Senior Broker, Environmental Markets at TFS Green Australia. The TFS Green Australia team provides project and transactional environmental market brokerage and data services across all domestic and international renewable energy, energy efficiency and carbon markets.