The Clean Energy Regulator latest data release on Australia’s solar suburbs has begun to reveal the extent of the mini-boom that followed the last-minute multiplier reduction last December, which resulted in a 25 per cent increase in solar installations.
However, the distribution was not even, with some states making greater use of the last minute sales incentive. Installation volumes rose by 50% in the space of a month in Victoria, which was impressive off the back of its September surge, in which installations doubled in response to the feed-in tariff closure, before falling by two-thirds overnight.
Installation volumes in South Australia also jumped 50 per cent for the December mini-boom, and NSW’s steady increase accelerated. Western Australians did not rush to the same extent, and Queensland’s slow come-down from its Solar Bonus Scheme frenzy caught a slight second wind.

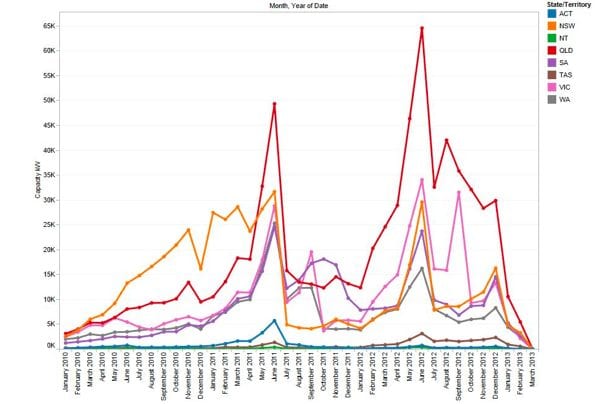
The 2013 data provided is too incomplete to draw conclusions from, but is already revealing an underlying market of similar size to previous quiet times. Though data is incomplete for the last 12 months, it is especially incomplete for the last 60-90 days, which means 2013 figures are highly understated and show a greater drop-off than has actually occurred. But from these early figures, we can already see that installation volumes in January 2013 were:
- At least equivalent to the July 2011-January 2012 period in NSW, which followed the end of its Feed-in Tariff installations
- At least equivalent to the October 2011-January 2012 period in VIC, which followed the first wind-back of its Feed-in Tariff reductions
- At least equivalent to the October 2011-January 2012 period in WA, which followed the end of its Feed-in Tariff installations
- Considerably less than the January 2012-April 2012 period in SA, which followed the first wind-back of its Feed-in Tariff reductions
- Almost equivalent to the July 2011-January 2012 period in QLD, which followed the multiplier reduction from 5 to 3
What this shows is that there is clearly a stable ‘underlying’ market in Australian PV. The challenge is that January’s figures were 31MW or greater – implying that the underlying market is 370-400 MW.
This could be seen a cause for celebration, as this was the size of the ‘free solar’ market in 2009 that was driven by incentives… but its not a volume that will sustain the number of jobs and solar companies that can presently deliver 172MW in a single month, or 1000 MW in 12 months.
The challenge for the industry will be to create a sense of urgency for potential solar customers, a sense of urgency that was previously provided by governments when they were about to slash incentives.

The opportunity exists for solar companies to utilise market intelligence that was previously only wished for. The Clean Energy Regulator’s data release allows anyone to perform postcode-level analysis on where the best opportunities lie in any region.
Through transforming this data set into an interactive visual explorer, SunWiz provides its Solar Hot Spots subscribers with the ability to quickly identify regional growth opportunities. Interestingly, there were some key locations that saw exceptional growth in Q4 2012, and they weren’t in areas you would expect. Record figures occurred in one Northern Queensland Location, but two of the most interesting opportunities were in Tasmania, with Launceston recording a record month of 326kW. You can interactively explore a map of total installations by suburb on our Hot Spots webpage.
Meanwhile, those interested in which markets and which states to best target over the coming five year period should read this article and about the Australian PV Forecast 2012-2017.
Pssst …and by the way, we’re agonisingly close to celebrating our 1 Millionth PV system in Australia.
Warwick Johnston is principal of SunWiz.