As ever here at ITK we look forward and not back. So, for us, it’s not so much about what happened in 2020, directly, but what it means for 2021 and beyond that’s of interest.
In summary:
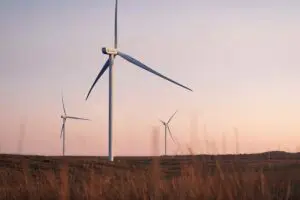
Wind and solar grew market share and future growth is completely locked in. 50% VRE by 2030 is pretty much a certainty. This will lead to prices being low but volatile.
Coal power stations, probably Yallourn and perhaps Vales Point, will close earlier than expected. We will likely see Gladstone substantially reduce its output before it reaches 50 years of life but certainly utilisation of the Queensland coal fleet fell in 2020 and will keep falling.
Ramping capability of the coal fleet is going to be an increasingly big deal.
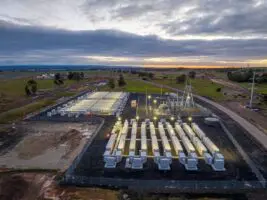
2020 was the year when utility-scale batteries moved from the novelty item to the mainstream of the electricity market. However, in ITK’s view we ain’t seen nothing yet.
2020 was also a year when behind the meter solar, where costs have fallen 18-25% in two years, stepped up yet another gear to be on track for close to 3GW of annual installations.
However, it was also a year when little or no transmission progress was made. In ITK’s opinion, not enough progress was made on progressing the technology challenges of falling inertia, frequency control and voltage management.
AEMO cannot expect the AEMC to solve these technical issues on its own. AEMO needs to do more to drive grid forming inverters, virtual synchronous machines and sophisticated control software forward.
It was also a year where the states walked all over the NEM governance arrangements. This was partly the fault, in ITK’s opinion, of the AEMC being overly reactive, but mostly because the federal government left a vacuum that the states were forced to fill.
Not only have states taken over the role of investment drivers, but to prevent disorderly closure of coal stations it’s increasingly likely that planning will be used to manage and smooth exits.
Finally, in 2020 we started to see the first signs of industry consolidation as the long-term stayers started to sort themselves out from the pack. ITK anticipates debt refinancing, the advantages of scale and the scarcity of management talent will lead to ongoing consolidation of the VRE sector.
Going further out on a limb, ITK expects that the traditional gentailers will continue to lose market share. So far they show little or no sign that they really get it, or if they do they seem incapable of doing anything other than just rolling over.
Geopolitically the consensus for action strengthens
Internationally, the news was positive for decarbonisation. Europe moved further in front of the rest of the world in its decarbonisation efforts and plans, with the UK leading the way.
ITK still thinks of the UK as part of Europe. Europe’s carbon price is an orders-of-magnitude better policy than anything else.
The UK shows that getting rid of coal is not that hard.
Outside of Europe, several Asian countries started to adjust their course and, in particular, Yoshihide Suga has signalled much change in Japan. But can he take the Japanese industrialists along for the journey? In the US, the Biden presidency will see the nation resume progress but the states will in any case keep moving ahead.
In China there is talk, but China doesn’t even publish its emissions and it’s unclear to me whether Xi Jinping can actually deliver.
A nod to hydrogen and electric cars
Outside of electricity the world restarted its long-running but yet-to-be-consummated hydrogen affair.
Alan Finkel was the first to start the ball rolling in Australia but he’s all but been run over in the rush. Australia is just one of the crowd in hydrogen as every country seems to think it’s part of the solution.
ITK remains on the hydrogen sidelines; we see a role, but perhaps only modest and making money will be a real challenge. It’s not so much about supply, but demand.
For cars fuelled by green hydrogen, around 50KWh of wind or solar is needed per 100km of movement, for electric cars its 25kWh.
For other sectors, start with this wonderful chart. I say wonderful because only when you try to build one yourself will you see how much work has been done to summarise so much info in one chart, but that’s another story.

The authors of the above graph argue that in Europe about 50% of industry emissions could be removed by further electrification of process heat and similar. That is without the use of hydrogen.
The blue bars section can be done with heat pumps and the yellow bars are electricity which can be done with firmed renewables. That leaves the high temperature process heat, the feedstocks and steam.
Looking at some key products I put this table together from Lieberich Hydrogen demand. It purports to show the required hydrogen price relative to what I regard as a reasonable, that is less than about €50, carbon price in order for hydrogen to be competitive, at least in Europe.

And regarding cost, there are two ways of making green hydrogen, but if I focus on the alkaline method I still end up with high costs relative to gas, even with some aggressive assumptions.
More to the point, reducing the electrolyser cost has only a moderate effect on the hydrogen cost. It would be better to reduce the electricity cost.

And I haven’t even got to the transport cost.
For electric vehicles, it’s another story. For Tesla, 2020 was a sharemarket breakout, for the European, Chinese and potentially Japanese EV market it was a policy breakout year.
For other mainstream auto makers looking to get into EVs – particularly VW, Hyundai and perhaps Volvo – 2020 was a year of finding out that it’s a lot harder to copy Tesla’s success than it seems from the outside.
For Australia it was a wasted year. In ITK’s view nothing, absolutely nothing shows the federal government’s lack of policy ambition more than its failure to develop a reasonable decarbonisation policy in transport.
The map below only shows countries with formal phase-out targets and misses the policy step-up in Japan and China. Even so, there is a lot more colour on the map than a year ago.

Scott Morrison needs to change the team to have any credibility in decarbonisation
The relevant federal ministers that might think about carbon, are Angus Taylor, minister for energy and emissions reduction, Keith Pitt, minister for resources, and Michael McCormack, minister for infrastructure, transport and regional development.
Finally there is Susan Ley, the invisible minister for the environment. That team has between Buckley’s and zero chance of being taken seriously.
I find it impossible to imagine that Michael McCormack could develop a fuel standards and electric vehicle policy for Australia. Maybe I need more imagination.
Making change starts with putting the right people into hot seats. This was clearly illustrated in NSW where Matt Kean would be in line for Australian of the year if I was handing out awards.
There doesn’t appear to be a federal equivalenet of Matt Kean, unless it’s Marise Payne or Simon Birminham. Josh Frydenberg could do it, but he won’t having had a go previously and now having the seemingly bigger but actually smaller job of Treasurer.
No team, no credibility. That’s how it works. Scotty from Marketing will understand that.
Australian electricity production decarbonises but…
Overall Australia continued to decarbonise its electricity system, thanks to federal policies put in place long before the current government, state government policies and the wishes of the population. For the full 365 days to Dec 21, wind and solar combined and including rooftop represented 19.4% of production and including hydro 26%.
Coal lost 2% of market share, significantly in Queensland and New South Wales, but brown coal gained share in Victoria.
The latter reflects improved plant performance and is surely temporary. Total electricity demand appears to be down 3TWh or about 1.5%, but a bigger fall in operational demand.

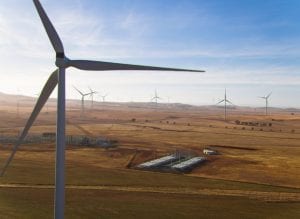
Wind and solar made gains in every state for the year, and if we look at the past 30 days, a seasonally strong time of year for solar, South Australia is at 70% VRE. The following figure excludes South Australia

And by fuel we can see that, despite its great promise, utility solar runs well behind both rooftop and wind.

For 2021, ITK forecasts about another 2.5GW of wind and solar, excluding rooftop, will be commissioned. That’s more or less the same amount of energy as a 1000MW coal generator.
We see about another 4GW of utility wind and solar that will start or progress its construction.
For behind-the-meter, it’s hard to tell. I’m as bad as the IEA, because I keep expecting installations to slow. But they keep growing.
One reason is that installation costs keep falling, down by about 25% in Brisbane and Melbourne over two years for a kW system and about 18% in Sydney.
These prices are obviously much lower than the apparent capital cost of a single tracking utility-size solar farm; no PPA is required, there are no transmission losses (well DC to AC), and the LCOE is possibly quite similar.
How can utility solar compete? With interest rates so low, financing is low cost. It’s still a winner, with a nice payback.

We expect to see the first of the NSW capacity auctions in the back half of the year.
Pool Prices
Spot electricity prices fell sharply during the year, most noticeably in Victoria.
Looking forward, ITK continues to expect prices to be around the $A40/MWh to $A60/MWh.
We think investment bank analysts who continue to project a recovery in gas prices into a recovery in average electricity prices don’t fully appreciate how the market is changing and, broadly, the likely lesser role of gas in setting electricity prices out to 2030.

The following chart is taken from the risks to AGL profits. Note ITK published this following the the NSW road map annoncment.
China decarbonises slowly and coal-fuelled electricity is expensive
For years I have been writing in note after note that China needs imported coal to run its coal generation fleet and that means its electricity sector is going to be uncompetitive longer term. And that’s before we even get to carbon and European border taxes and so on.
China’s cut off the nose to spite the face approach in regard to Australian coal imports serves to illustrate that vulnerability very clearly.
Australian thermal coal exports to China are only modest, but still enough to disrupt the country.
Recently, electricity production in China has been growing at about an 8% pace. Hydro production has grown somewhat faster and thermal production somewhat slower.
Last year we were surprised that there weren’t more thermal coal imports as coal production in China has been flat for years.
Its growing at a 3% pace based on the last three months, but we have long thought that coal-fired electricity in China has natural limits, as there is a limit to its own domestic coal capacity, and the industry is not low cost, and you can’t be a low-cost global energy provider based on imported coal.
And we still think that. If China wants to remain as the world’s energy-intensive goods manufacturer it needs to lower its relative electricity cost and that can’t be done using coal. Reports are that 5500 kcal coal in China is presently over US$100/t + delivery.
That means the fuel component of the electricity price is over $A47/MWh + operating costs + capital costs.

Of course the powerful Chinese state-owned electricity companies will be shouting about how this means China needs more coal-fuelled electricity stations and more coal output. But that way lies true disaster for China, at least in ITK’s opinion.
Wind and PV have a combined 7% of the Chinese market. By contrast Australia which has an energy-intensive economy is about 23% over the same 30 days. Of course it’s winter in China. Still, China talks a big game. Let’s see what it can actually deliver.
Thanks, above all, to the Global Roam team
Being Christmas, it seems like time to wonder: what’s the point of being an analyst?
Often it feels like a cross between Cassandra and Rumpole of the Bailey. Whether there’s a point or not, the truth is that without the help of the rest of the ITK team and the data resources provided by Paul McArdle and the Global Roam team, it would be an order of magnitude more difficult to add any value.
Equally, there are many industry figures who take the time to explain things and provide insights. Until you have tried forecasting you won’t realise how easy it is to overweight a particular information cue, or get carried away with an only partly correct idea.
It’s at those times that the odd bit of wisdom from someone that sees more clearly is so invaluable.
ITK worked on a number of reports that we are pretty proud of this year, and we produced new price forecasts within three days of the NSW Infrastructure Road Map announcement. But the work that I, personally, found the most interesting was on the seasonality of VRE production and the need for long-term storage.
We introduced to our lexicon the Cumulative energy deficit/surplus for high VRE penetration. Hopefully we can do something just as interesting next year.