− Spot electricity prices shot up and continue to be well above previous corresponding period (pcp).
− Volumes continued to be soft this week despite a return to cooler weather. NSW volumes were 5% below PCP and VIC 2%.
− Futures prices continue to increase
− REC prices were flat
− Gas prices increased sharply (31%) in QLD and NSW (23%) and prices in South Australia remained high
− Retailing discounts may have increased.
− The smaller end of the utility and renewable energy share market was again strong and we have added Orocobre and Genex to our list.

SHARE PRICES
Another strong week for some utility shares. This week we have added Genex (GNX) (market cap $30m) and Orocobre (ORE – market cap $0.9 bn) to our table.


ORE is a very interesting share as it represents an example of how Australia can participate in the global battery boom in a very traditional way. TORE is just ramping up stage 1 of a new lithium mine in Chile. The company states that the price of lithium is forecast to go a lot higher as demand increases strongly over the next few years.
As any experienced investor will tell you what is true at one point of time is unlikely to be the case all the time, and if the price of lithium goes up enough for long enough either demand will be curtailed and/or, much more likely, there will eventually be a commensurate increase in supply.
Still, that process can take years. Lithium is an abundant material in the earth’s crust but there are only a few suppliers of lithium at the moment. A link to a recent company presentation can be found here and it’s a good read. We reproduce a couple of charts from that presentation:
VOLUMES
Volumes jumped sharply during the week to be 3% above last year at the NEM level with even Victorian volumes showing year on year growth. For the calendar year to date, essentially the first six months, volumes are up 1% and probably would have been higher had it not been for Tasmania. Energy conservation has taken a back seat over the past 12 months but as the higher pool and futures prices start to show up, energy efficiency will again become more important.

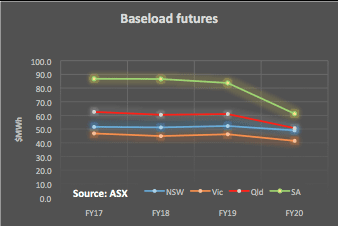
BASE LOAD FUTURES
Futures prices once again edged up. FY17 and FY18 prices have been edging up week by week for the past couple of months to be 8%-10% above levels of April in all States. In our view this adds up to consumers paying because their retailers haven’t made much progress on achieving the RET target.


SPOT PRICES: ABSURD AVERAGE OVER $140 MWH FOR THE WEEK IN NSW
These were exceptionally strong electricity prices in the NEM this week, but not because demand was exceptional by historic standards. The high prices are due to changes in supply. Fig 10 shows the 7 day moving average of the NSW pool price. We choose NSW, because demand is largely unchanged from last year, there are no big power plant closures and yes there is less generation from QLD, but is it just market behaviour?

There weren’t any prices above $300 MWh in the past week, it was simply that the averages were high. To analyse this we turn to NEM Review and and look at supply into NSW comparing the 30 days.


Perhaps the only surprise in this is that supply from Victoria is down. Because prices in Victoria are lower than in NSW we’d have expected more supply from Victoria into NSW. The increase in renewables more or less offsets the reduction in coal supply, so it’s the interstate transfers that make the difference. All that said the price response is much larger than might be expected and more investigation is required.
GAS PRICES IN QLD MOVING UP
Gas prices would be expected to increase on a seasonal basis, but the jump in QLD prices this week was strong. The LNG plants in QLD are clearly ramping up quickly, these plants are actually very simple as far as LNG plants go because the gas is dry and relatively clean so the plant doesn’t have to strip the liquids or remove many impurities. Gas prices are actually still relatively low considering the increase in demand the LNG plants have created.
We think this is because there are still two trains to come on line, and because the productivity of the gas wells is generally excellent particularly in these early months and years. The true test of the LNG plants long term costs will be in 3-5- 7-10 years out as the early gas fields get drained and new, lower productivity fields have to be developed. Still, by September 30 this year we expect APLNG train 2 to be commissioned and the outlook for gas prices over the subsequent 12 months fairly clearly established.

DISCOUNTING MAY HAVE PICKED UP IN THE PAST MONTH
Once a month or so we like to look at the discounts on offer. We typically use AGL. We look at standard offers, for instance we have ignored the $75 AGL is offering off its first bill in the below calculations. Since the retailer has no control over the monopoly regulated charge we look at the gross revenue an 8 MWh customer will pay the retailers after backing out network costs. The retailer still has to back out environmental costs, line losses, the purchase of power and their own costs before getting to gross profit. We think discounting may have increased in the past month.


David Leitch is principal of ITK. He was formerly a Utility Analyst for leading investment banks over the past 30 years. The views expressed are his own. Please note our new section, Energy Markets, which will include analysis from Leitch on the energy markets and broader energy issues. And also note our live generation widget, and the APVI solar contribution.


