Household and business rooftop solar PV forecasts – state by state

See separate story for South Australia forecasts, including predictions that rooftop solar will reduce grid demand to zero by 2023.

Here are the state by state rooftop solar PV scenarios included in the Australian Market Operator’s 2015 National Electricity Forecasting Report. In almost every instance, the medium and long term forecasts have been upgraded significantly from last year.

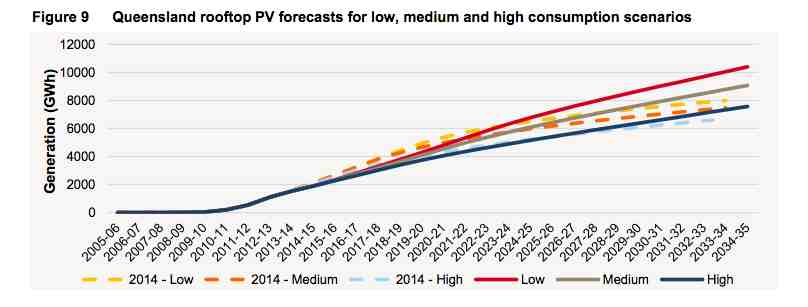
We begin with Queensland, where AEMO says that over the longer term revisions to its commercial PV forecasts dominate the growth in its longer term projections, resulting in higher forecasts than the previous NEFR. It says solar PV will shift the time of maximum demand from 17:00 to 19:30 over the forecast period.

aemo qld solar

And these are the range of scenarios from AEMO, from low to high, and how they have changed since last year.

aemo qld solar scen

In NSW, the uptake of rooftop solar is the second biggest in the country, but because of its relatively low penetration, it does not actually shift the time of maximum demand, according to AEMO’s forecasts.

aemo solar nswAnd these are the range of scenarios from AEMO, from low to high, and how they have changed since last year.

aemo solar nsw scen

In Victoria, as in other states, AEMO notes that residential rooftop PV uptake continues to be driven by the federal Small-scale Renewable Energy Scheme (SRES) and the “increasing economic viability” of rooftop PV.

It also notes that the programs that incentivised the historical uptake have helped to establish a local industry and drive a reduction in PV technology and installation costs.

The uptake in the commercial sector is being driven by a combination of programs such as the Clean Technology Investment Fund and SRES, as well as the continued decrease in PV costs. This is making the business case more attractive.

aemo vic solar

And these are the range of scenarios from AEMO, from low to high, and how they have changed since last year.

aemo vic solar scen

These are the forecasts for Tasmania, which has the lowest take-up of solar in any state.

aemo solar tasmania

aemo tasmania solar scen

Please see separate story for forecasts for South Australia. The state of Western Australia is not included in AEMO forecasts, as it is run by a different market operator. The ACT is included in NSW data.

Comments

5 responses to “Household and business rooftop solar PV forecasts – state by state”

  1. Steve M Avatar

    I don’t think they understand the exponential function, the only way this modelling could be accurate is if they were to halve electricity costs but with what just got released in QLD I imagine that the take up of solar + storage will blow this out off the water. I know of one business who was considering running a diesel generator rather than being connected to the grid at 39c per kwh.
    Next time they want to waste money on modelling graphs they should let me know my 4 year olds very good at painting!!

    1. Chris Schneider Avatar
      Chris Schneider

      What is this 39c? where did that come from?

  2. Ray Miller Avatar
    Ray Miller

    Thanks Giles, estimates for PV growth have historically been “conservative” with various adhoc and complex drivers.
    A couple of points, while we have some record of PV installations, due to the way in which the PV grid energy is metered by the utilities the true impact on the grid is but a poor guess, no hard and fast gross metered numbers.
    Two perspectives or worlds- the industry points to and uses the AEMO wholesale market prices traded in increments less than an hour. Many live and breath the minute by minute gambling using time of day, weather, moon phase etc.
    The majority of end users see monthly or three monthly bills with anything but a price that has anything to do with the wholesale price, in fact the “true” total cost divided by the energy delivered can be over 1000% greater.
    PV systems fit into and compete in the retail market, have next to no transmission loss, are geographically distributed exactly where the customers are , fit within the confines of an elevated platform i.e. roof with the energy from PV rarely going beyond the local transformer let alone the substation.
    The opportunities are for the utilities to embrace and truly value the technologies, have an input into the siting, design to maximise network value with stability and demand.

  3. Glenn Corbett Avatar
    Glenn Corbett

    WA, ACT and NT?

  4. Chris Schneider Avatar
    Chris Schneider

    I hope it’s a lot faster than this. The reality is for a business if you have the opportunity you should be installing Solar. Our calculations put an ROI of around 3 years! then you have free power (or a percentage)! I can see in Queensland at least this becoming very common in the coming few years. With batteries falling so quickly I would predict if the Energy companies don’t look at grid storage in the next year and charging a better feed in tariff a lot of people will leave the grid all together. The numbers stack up for me at home right now.

Get up to 3 quotes from pre-vetted solar (and battery) installers.