New analysis by the Australian Energy Market Operator has confirmed that the large amount of rooftop solar in South Australia helped shift the peak in demand during the recent heatwaves that affected the southern states.
The analysis by AEMO compares how the electricity grid coped during the heat wave in 2014 with a similar one in 2009. All things are pretty much equal, except that in 2014 there are more people, more air conditioners and a lot more solar than five years ago. Wind capacity has also increased.
The biggest change identified by AEMO was how rooftop solar has shifted the peak in South Australia. That shouldn’t be surprising, given there is 450MW of rooftop solar PV in a part of the grid that gets maximum demand of just over 3,000MW. Not only are there more rooftop systems in SA, there is also more sun.
Consider this graph below, because it is just the beginning of the remarkable transition we are about to see in Australia.

It shows comparisons with the 2009 and 2014 heatwaves. The blue line is 2009, when there was practically no rooftop solar PV. The yellow is 2014 demand, including solar, and red is demand from the grid not including solar. (Red and yellow merge into orange as the sun goes down).
Note the big difference between the yellow and red lines. That is a chunk of demand that has been taken away by solar. On January 14, even at the very peak operational demand, it was contributing 6 per cent of total demand.
As AEMO says: “The contribution of solar is a noticeable percentage of the total demand in South Australia. The data indicates the solar could be contributing to shifting the time of the peak demand in South Australia during the high demand days.” Indeed, two of the peaks occurred at 6.30pm, when they had occurred much earlier in previous years.
It doesn’t take a whole lot of imagination to think what might happen if just one hour, or even a few hours of battery storage – or any other storage for that matter – were added to the local grid to support solar capacity.
The red line would be virtually decapitated. It must be an extremely interesting proposition for the network operators, looking at where the value of storage on the grid might be. On the other hand, it’s just an awful proposition for the generators, who rely on peak pricing to add the cream to their profits – or in some cases, enough revenue to meet their debt repayments.
The graph in Victoria is not so spectacular for solar. That is understandable because while it has 520MW of rooftop solar, its section of the grid has peak demand loads in excess of 10,000MW, and Victorians would be shattered to learn their solar resource is less good.
The graph below shows this.

The impact of solar was less pronounced, although it did reduce demand during the afternoon. AEMO noted it barely shifted the peak. But, once again, imagine what an hour of two of storage would do – another decapitation, this time of revenue bonuses for brown coal generators, most of which rely on such events because they are hocked to the eyeballs in debt.
AEMO says solar does not appear to be shifting the time of the peak demand in Victoria during the high demand days at this stage, but it may be doing so on lower demand days, when there is high solar output. It says it is investigating this.
What about the remaining generators? The other big change in the electricity profile was the existence of more wind generation, and that the dams were full, which meant a lot more hydro was available in Victoria.

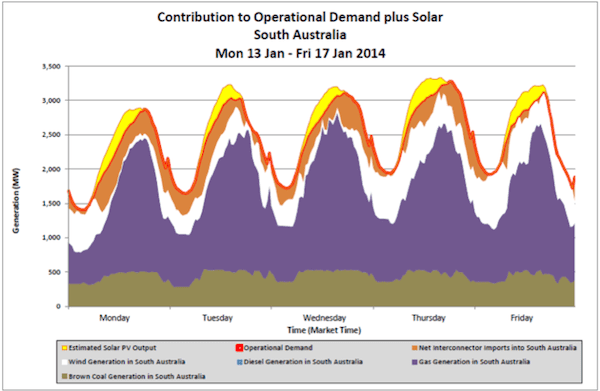
This graph above of South Australia shows Northern and Playford power stations chugging away at the bottom, and gas filling in the gaps of demand – as it has done for the last few decades. It’s just that with more wind and solar, the gaps are not so big any more. Either gas – or mostly coal imports from Victoria, would normally be needed to reach the top of the yellow space, which is now filled by rooftop solar. The chart shows that wind (SA has the most amount of wind in the country, too) was contributing between 11 and 18 per cent at the moment of operational peak demand on three of the days, and just 2-3 per cent on the other two.
Here is the graph for Victoria (below). It shows little has changed. Brown coal generators dominate, gas fills in the gaps, although hydro this time was very active – including the hydro imported from Tasmania (that accounts for most of the orange bit).

Wind contributed little in gross during the whole week. In effect, little has changed since 2009 – although AEMO noted that it only would have taken the sudden failure of one of the big fossil fuel generators or the interconnectors to force several pot lines of aluminium smelters out of production.


