The declining trend in electricity demand and emissions continued in July 2013. The total reduction in annualised NEM generation since July 2012 was over 4 TWh (2.2%) and the reduction in associated emissions was about 11 Mt CO2-e (6.3%).
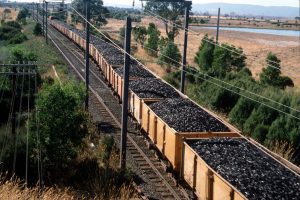
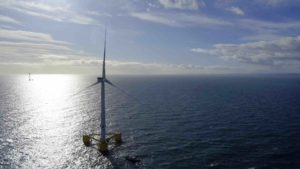
Of this total emissions reduction, about 40% can be attributed to the fall in demand and 60% to the shift in generation mix to lower emission sources. These changes are shown in Figures 1 and 2. For the first time for over a year, hydro generation fell slightly; this was caused by significantly reduced Snowy generation in July 2013, compared with July 2012. Gas and black coal generation also fell slightly, while brown coal and wind were virtually unchanged.


In late June, AEMO released the detailed data behind its most recently published set of electricity demand projections for the NEM (which has modest demand growth resuming in the near future). The published data includes estimates of the contribution which rooftop PV is now making to total electricity consumption. Strikingly, AEMO estimates that PV generation increased by nearly 1.3 TWh in 2012-13, compared with 2011-12. This suggests that PV accounted for about one third of the total reduction in output from NEM generators during 2012-13, making it an important driver of the changes in the electricity market.
Figures 3 and 4 show the continuing downward trend in demand in the various NEM regional markets. They also show that total demand in WA, while not clearly decreasing, is certainly not growing, and in fact has not increased for two years. Given the State’s high rates of population and economic growth, no increase in demand for electricity implies a substantial fall in per capita demand and in the electricity intensity of the State’s economy, of similar size to that being experienced in the NEM states.
Now that the time of winter peak electricity demand has passed, this issue of Cedex® Electricity Update includes an update of the year on year system seasonal peak demand in each state market. Peak demand determines the required capacity of transmission and distribution systems and hence is a major driver of investment in these sectors of the electricity supply industry.
As Figure 5 shows, in every state market except Tasmania (not shown), and the occasional exception of NSW, annual peak demand occurs in summer and is caused by the demand for space cooling on very hot days. Around 2006 and 2007 there was a general expectation that summer peaks would continue to grow rapidly, and this led to regulatory approval for very large investments in additional transmission and distribution capacity. These costs have been a very large contributor to the increase in electricity prices experienced since that time.


In fact, as Table 5 shows, summer peaks have not grown for several years. The highest ever peak in Victoria was four years ago last summer, the highest in Queensland three years ago, and in NSW and SA two years ago. Some commentary has suggested that the reduction in peak demand has been caused by the absence of very hot days in recent summers.
Analysis by pitt&sherry has demonstrated that this is not the case, by examining the relationship between the severity of the weather on the actual peak demand day and the size of the peak.
In Queensland, for example, the peak day in 2011-12 was hotter than any since 1999-2000, but peak demand was lower than it had been in either 2009-10 or 2010- 11. Increased energy efficiency, changing electricity consumer behaviour, increased uptake of rooftop PV, and the other factors which have been driving reduced demand for electrical energy are also reducing the size of demand on peak days.