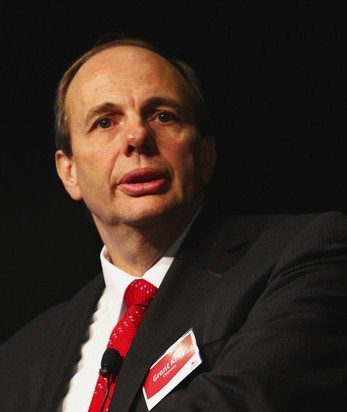
This is a transcript of a speech given by Origin Energy CEO Grant King at a CEDA luncheon in Sydney on Monday.
I should have thought to make a subtext for today’s speech as to never let facts get in the way of a good argument, and what I hope today is to present some facts as we see it and some perspectives as we see it on matters relating to the energy industry broadly and quite often, particularly in respect of the electricity industry.
I will apologise in advance that I will use a few slides to do so because sometimes just a picture or some data helps put some of these comments in perspective. Essentially, what I want to do in talking about our electricity or energy supply systems is to begin by reflecting on what do we want from that system because, fundamentally, first, one needs some objectives. It’s only against objectives that you can test what good or bad looks like, and the objectives that we most often hear talked about in the community and the media, from our politicians, is that we want cheap energy, certainly competitively-priced energy, and obviously over the last 10 years, and five years in particular, we want lower carbon intensity from the energy that we use. But my view is this is only two of the three essential factors that we should be talking about in terms of objectives from our energy supply systems because the third is reliability, and in my view, when we talk about them, reliability is actually at the top of the list. It’s the most important one.
So that’s the order I would like to talk about things: reliability of our energy supply, whether or not we’re achieving our objectives in reducing carbon emissions, and at what cost, and ultimately how that’s reflecting on the price to consumers, which of course is a very, very important matter for all consumers. So if we deal with reliability first, and hopefully I can move this along a bit. Why do I put that at the top of the list? At a personal level, I think, many of us can reflect on that because if you ask yourself the question, and many of you may have had this experience, how long do we go without a hot shower, generally we’ve found in our business that people will wait a day to get it fixed, but most people won’t go much past one day before they will pay just about anybody whatever it takes to get that new hot water system in place. So at a personal level, we can reflect on that, and if any of you are in a different space, I’m glad you’re not sitting on my table today. But if we look more broadly, we have seen not that many, but extraordinary examples of the cost of unreliability, and the reason reliability is at top of our list of objectives is the cost of unreliability is so high.
There are few events in Australia. Some of you might remember Longford in the 1990s, when there was a failure at the Longford gas plant and Victoria was without gas for three weeks. The cost of that was estimated to be around $1.2 billion to the Victorian economy. In South Australia, interruption to gas supply for industrial use and power generation in the early 2000s where there was an incident at the Moomba gas plant would have seen that state without gas for months other than for the almost coincident commission of the SEA Gas pipeline just previously. Overseas we’ve seen very large examples. Some might recall in Auckland, I think it was in 1999, there was a failure of transmission systems into the city of Auckland and Auckland was without power for three weeks. That cost the local distributor about $120 million in costs and penalties and had an untold impact on the community. And, of course, we can get bigger and bigger examples. In The States, again in the late 1990s, there was a software glitch in a control room in Ohio that resulted in a blackout in North‑East America, resulting in loss of supply to 55 million people and subsequent work-attributed 11 deaths to that event, and obviously huge economic cost. And, of course, the mother of all blackouts was in India last year, where power supply was lost to 600 million consumers.
Now, we’re fortunate in Australia that we do not suffer very often from these events, and the reason is that generally we have substantial investment in our distribution and transmission networks and in our energy production facilities that provide the necessary redundancy to protect us from these events. So, for example, just last year, in June/July, the Yallourn Mine flooded yet again, taking out one of the largest generators in the state, but it had no impact on reliability of supply, but a slight impact on costs. And, of course, by the way, that impact on cost is borne by retailers, those organisations that stand between the supply and consumers, and really wear amongst other things the cost of those sort of events. But the reason that occurred was there’s plenty of redundancy in the system, there’s enough spare capacity in the system. Similarly, in South Australia, they didn’t suffer so much from the Cooper incident because the SEA Gas pipeline had just been built. But we have to pay for that infrastructure. We have to pay for that to occur, and quite often, because the perception is that our power systems in Australia are so reliable, we don’t value that investment.
Now, in respect of that part of reliability that derives from our transmission and distribution networks, the only point I make is that that’s essentially a matter from the regulator, for the regulator, and Michelle may well have something to reflect on in that regard later on. But getting that balance right between the investment we make in ensuring that our transmission and distribution systems are up to the task and have sufficient capacity to cope with disrupts is an important balance. People often talk about these systems being gold-plated, but I think it’s only the regulator that’s well placed to probe and investigate and scrutinise the costs that are put forward to it and determine the level of pricing or the level of investment, the level of pricing that’s appropriate to ensure we have reliability at that level.
But, of course, the other aspect of reliability comes from our energy production facilities, and on this occasion I reflect particularly on our electricity facilities, and the question there is, doe the wholesale electricity market function efficiently, does it provide us with the reliability of supply that we seek? Something like 13,000 megawatts of new generation in a system totalling 45,000 megawatts have been added since the NEM began, and over the last 10 years, the greater part, by far the greater part of that investment, has been made by the private sector, and we clearly have both sufficient in total and timely investment in generation that ensures that we have the reliability of power supply.
There is sufficient, if you like, spare capacity or redundancy in the system to ensure that consumers have a reliable supply of power. And, of course, they’re also entitled to say again, but at what cost? Is this supply competitively priced? And here is a high level view of pricing in the NEM and since 1998, the 14 years it came into existence. The two lowest average prices, if you like, time weighted or flat prices, in the NEM were in its first full year, I think which was 1999, thereabouts, ‘88/99 – ‘98/99 and 2011/’12. And generally, whilst there has been a few ups and down, the bigger part of that driven by the very dry period we had in the late-200s which affected water supply to some generators, the NEM has produced both a remarkably consistent and an extremely competitive price of electricity before carbon of somewhere around $40 a megawatt hour. And, as I say, today the same, in nominal terms, as it was 10 or 11 years ago. So in my view, the national electricity market has been an extraordinarily effective tool in delivering both reliability and competitive prices to consumers. But, of course, that only forms one component of the price of our energy.
So in respect of the first of those three objectives, what do we say? We say reliability is very important. We’re fortunate to suffer very rarely from a lack of reliability in our systems. We very rarely see the sorts of disrupts that have occurred occasionally but when they do occur, they are phenomenally expensive and often potentially come with some tragic consequences as well for people who rely – you know, on lifesaving devices, for example, in respect of electricity and gas. So generally, we have reliable systems but we must pay for that reliability. And, as I say, we primarily rely on the regulator in respect of network charges to do that and we rely on the competitive wholesale market of energy to do that for us in respect, for example, of power generation. I have to say, in respect of power generation that we are increasingly seeing regulators extend their interest into that area because, if we think about those areas that still have retail price controls – and we now have two states that don’t, South Australia and Victoria – but in those areas where we have retail price controls the way those controls work are effectively, to pass through the two major components of energy costs to consumers which is network charges and all of the green costs.
And increasingly, they’re spending their time trying to predict what the wholesale cost of energy means and it’s a complete folly to try and take an efficient market which has demonstrably delivered good outcomes, in terms of both available capacity, reliable capacity and price, and then try and actually guess, from a regulatory point of view, what that price ought be going forward. So by far the most compelling reason why regulators should not be involved or pricing authorities should not be involved in retail pricing is they’re increasingly regulating generation and interfering with the investment signals in demonstrably the most competitive and most effective part of the market. So if we then move on to look at our second objective – so clearly, reliability is one that affects costs, prices to consumers – and the second is the objective or the desire of reducing carbon emissions, better environmental outcomes, more broadly, but specifically, reducing carbon emissions. And my focus here will primarily be on the impact of the RET scheme and the carbon pricing scheme.
Now, at various points in the past we’ve had a plethora of schemes all designed to, in some way, shape or form, help us reduce carbon emissions. At one time, I think there was an estimated 230 schemes of different forms that had been put in place. But fortunately, many of those have been unwound as we increasingly rely on these two primary instruments which is the RET scheme and, of course, the carbon pricing scheme. Now, in respect of the RET scheme Origin’s position on this matter is well known and, that is, that in respect of the target, the hard wired target, that 45,000 terawatt hours – if you remember that in megawatt hours, 45 terawatt hours, if you remember that number – it was hard wired in 2008 which an examination of the records will tell you was the peak year for demand for electricity consumption in 2020. All of the current and most recent forecasts are for 2020 – demand for electricity in 2020 will be much less than it was estimated to be in 2008. And the result, that hard wired target now looks more like 27 per cent of the amount of energy to come from renewable sources.
So what I want to do is examine very briefly what we see is the impact of the RET scheme on our two objectives of reliability of supply and pricing, as well as the impact of the carbon scheme on reliability of supply and pricing. And the first point we note is that in the near 10 years of the RET scheme to date it has delivered several thousand megawatts of renewable energy, primarily wind. But in order to achieve the target in its current form, it will require an extraordinary increase in activity in the period through to 2020, a level of build and investment well in excess of anything that’s achieved to date in the industry. And we have to question whether the crowding of that much investment into this period of time will produce the sort of outcomes we are seeking. And for those of you who are involved in wind projects you will know that they’re complicated projects to permit. Not so complicated to build but really quite complicated to permit because they’re not overwhelmingly supported, particularly by the local communities in which these schemes occur.
But the massive increase or requirement for meeting that RET target – which, as I say, is a higher percentage than we’ve historically thought – will require a much higher level of build activity. And in our view, that build activity will drive us up the cost curve, not down the cost curve. This is Origin’s view of the cost curve for wind with the target that’s currently in place. And quite clearly, and even as a matter of logic, we can understand that the costs will go up because largely, the economics of wind is driven by the capacity factors and location of the sites. And the further we move from transmission infrastructure and require more transmission investment and the more we move to lower capacity factor sites as the better sites are used, the more we will drive up that cost curve. So we believe that the current policy setting will really drive up the cost of this part of the scheme relative to past costs. The other aspect, of course, if we continue to focus on our objectives is what does it do to reliability of our systems.
And historically, in the NEM there has been volatility in demand. That’s what has driven volatility and ultimately, that’s what causes generators to despatch more or less power to meet that fluctuating demand, largely driven by weather, of course, both daily and seasonally. But we are increasingly, through the operation of the RET scheme, injecting more and more supply site volatility into the system. So this is a day I’ve referred to in other presentations, in November last year in Victoria where Victoria had a record system peak for November. It was a very hot day, obviously, and you can see hopefully from this chart that at the time that demand peaked the amount of generation from wind was at a minimum. It went from 14 per cent to two per cent of energy provided at that time. And it’s well understood that the reliability factor, not the capacity factor but the reliability factor of wind is very low. I think from a planning perspective it’s generally below 10 per cent and possibly eight per cent. So this investment in renewable is driven or RET driven renewables, which is largely satisfied by wind, will drive increasing volatility and potentially increasing unreliability in the NEM unless, of course, that power is firmed and most likely, firmed by open cycle gas to provide us with the reliability but, of course, at an additional cost, a cost greater than the actual cost of the wind itself.
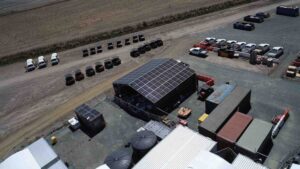
If we also look at the other aspect of the scheme – and it’s worth noting that the RET really comprises two schemes or two sub-schemes, the SRES scheme and the LRET scheme, and that LRET is the one I’ve just talked about., one that at the moment, on current settings, will be largely cleared by wind and has a fixed target of 45 terawatt hours and, of course, the PV – will not just PV, the solar schemes which are really uncapped, there is no limit, and which attract a fixed price of $40 a certificate. And let’s have a look at the impact that solar has had on our systems. And clearly, we’ve seen a very substantial increase in the amount of solar, particularly solar PVs installed and therefore, solar energy generated in the system. We can make two comments. I will come to the cost comment in a minute. But if we look at its impact on systems you can see that on a summer day – and this is in Queensland – it is reducing the peak. It’s clearly providing energy, quite a bit of energy, but it’s also generating into the peak. And in some respects, even though the capacity factor of solar is quite a bit less than wind, it is actually a little bit better correlated to summer peaks and that’s the effect you can see. That the summer peak compared to the prior period, I think 2007 to 2012 is the period we’ve looked at, the summer peak is less largely, in our view, because of the impact of solar PV in that market.
But if we look at what happens in winter, of course, the peak is at night. The peak is when it’s dark. And therefore, solar PV is making no contribution to the peak in winter. And if you look at the actual levels of peak, somewhat surprisingly in Queensland that winter peak is actually marginally higher than the summer peak. And therefore, there is no avoided network costs that arise from all of this decentralised generation put into the system. In fact, we’re asking more and more from our networks to manage that system, that influx of energy coming into the system. And as many of you know – again, unless Michelle is going to tell us something different – broadly, our network costs are recovered by costs divided by throughput. And the more energy we put into the system without changing the investment we have to make in those systems, the higher the unit costs will be. And I will make some comment on that a little bit later on when I try and draw these themes together. So we are seeing increasing amounts of intermittent energy injected into the system which will have an impact on system reliability because we’ve now introduced not only demand site volatility but supply site volatility into the system. And in order to continue to supply customers with that reliable supply of energy – so on that hottest day or that coldest day or whatever day it is that you want to flick that switch and turn on your power and it’s there for you – we need to actually invest more and more in managing the increasing level of volatility or interruptability that has been introduced into these systems.
If we then move on from the RET scheme and look a little bit at the carbon pricing scheme and seeing what it’s doing, here is some data, some of which should be well known to you. On the left-hand side is the bit stack, before and after carbon. And it has often been said – and this should be no surprise – that the irony of our carbon price which we all know is $23 a ton at the moment has not changed the merit order. It’s far too low to actually change the merit order and it is therefore, not causing different decisions to be made, either in terms of capital investment or in terms of despatch of generators in the NEM. Now, that’s capable of being analysed and well understood just by looking at the costs and the impact of the carbon on the costs of various forms of generation. But we’ve had a look at the first six months operating under the carbon pricing scheme and we’ve had a look at how we actually – not we, Origin, but how the market sourced and generated its energy in the first six months of the scheme and that’s to December last year versus the prior corresponding period, December 2012.
And what you can see from that chart on the right is what the chart on the left would have predicted and, that is, there has been no change in the generating mix. In fact, as it turns out, notwithstanding that your Yallourn was actually out for part of July, that the amount of energy that came from coal fired generation in that six-month period as a proportion of the total was actually higher than the prior period and not lower. So clearly, there is very little evidence to us that there has been any carbon abatement as a result of the carbon pricing scheme in the first six months of its operation and that just seems to be evident to us on the facts. Now, one of the things we’ve tried to do therefore, just to inject an element of controversy into things is to say, well, what we really should try and do with all of this is look at something that’s not the carbon cost, as we all know it. As I said, you will all know that the current carbon cost is $23 a ton. But the really important point is not what’s the cost of carbon, it’s what the cost of carbon abatement. And what we’ve tried to do is construct what we think of as an abatement curve under the current policies that have been operating.
And there’s various ways you can think about that and if you can see that chart and read some of the descriptions from left to right you see we can begin on the left-hand side where you can buy carbon credits. You can source carbon credits, for example, from the European scheme and they’re currently trading somewhere around four to $5 a ton. And then you can move up – there’s a stack, if you like, of abatement alternatives. And what you can see is that it gets extraordinarily expensive extraordinarily quickly and you can take a number of views. So, for example, one of the common views is that the RET scheme – or, for example, SRET is part of the RET scheme, $40 a certificate. A certificate acquits a megawatt hour. A megawatt hour in the NEM is roughly a ton, a bit less than a ton of carbon, so therefore, it’s $40 a ton. And you could take that view but, by virtue of the previous slides and a slide I will show you, subsequently, it would seem to us, that that’s actually not the right view. What’s happening is that the renewable schemes are effectively displacing gas at a much lower carbon intensity and therefore, the truer cost of abatement under those schemes is more like $100 a ton.
In respect of the carbon scheme itself, the government estimated that it would reduce carbon in its first period of operation by about 15 million tons and that would therefore, represent an abatement cost because that has come at a cost of about $10 million, an abatement cost of about $700 a ton. But if you lead to the view that there’s no evidence that there has actually been any abatement under this scheme then effectively, the cost of abatement – pick a number, it’s ….. So it does reflect that we are paying an extraordinarily high price for carbon abatement. Not necessarily a higher price per ton of carbon but a very high price for carbon abatement. And it does beg the question whether our policies are serving us appropriately in this regard. One of the other ways we test what’s happening – and here is a picture over the 10 years that many of these policies have been introduced, 2002 to 2012. And these policies are primarily designed to change the fuel mix. At the end of the day we change the carbon intensity of the power we use by changing the fuel mix. And so we should look to see whether there is any evident change in that fuel mix over 10 years.
And what you can see if we look at fossil fuels – that’s coal and gas – they were contributing 85 per cent of fuel for generation 10 years ago and they’re contributing 85 per cent today. Exactly the same amount is coming from fossil fuels. But there has been some substitution of gas for coal, largely because most of the investment the private sector has made in the NEM has been for gas fired generation. And, of course, that part of the balance from renewables and other but largely renewables has stayed constant at about 15 per cent. And what’s happening is that wind is supplementing the old hydro. It’s often lost and most of our renewable generation obviously, comes from the many, many years past investment in hydro schemes in Tasmania and, of course, the great Snowy Mountain Scheme. But gradually, those have been supplemented by wind but, in very broad terms, 10 years ago 85 per cent of our power came from fossil fuels and 15 per cent came from renewables and some other minor contributors and that is still the case today. No fundamental change in that mix.
But, of course, our carbon intensity is lower because a lower intensity of gas is actually contributing to a slightly lower intensity across the NEM. And that is why it is our view that most of these schemes, particularly the RET scheme, that are seeking to displace fossil fuels is actually displacing gas, not coal, and that’s why the cost of abatement under these schemes is over $100 a ton. Now, that’s just on carbon price alone. I should add, as you will know from my comments, that those schemes do not cost into them the cost of additional transmission and distribution investment, the cost of additional generation necessary to firm the schemes and the cost of climbing up the cost curve and not down the cost curve. So our view is that those costs are seriously understated.
The CCA in their review last year completely skipped the opportunity to review the true cost of these schemes and we believe in the next review scheduled for 2014 we should really have a decent effort at telling the community what these schemes are actually costing us on a fully-costed basis. So if we then turn to the last objective and that is whether or not we’re getting competitively-priced energy. Well, very difficult to answer that question. This is the Bureau of Energy and Resource Economics work and this refers to the latest benchmark in studies they’ve been able to access in 2010 and they would suggest that the household price of electricity in Australia is in the bottom quartile of OECD countries – very, very competitive. But, of course, this data is quite old. It’s two years out of date. And we look forward to seeing a continued updating of this data to give us a truer fix of where we are. Is the cost of electricity in this particular case in Australia competitive – globally competitive?
There is no doubt we’re seeing large increases in prices over the last couple of years and that relative position might have changed a bit but I doubt whether it has deteriorated substantially, and I still suspect we would find Australia, on that comparative basis, did have a competitive cost of energy. So it therefore seems sensible in trying to just bring some of these thoughts together in as quick a time as possible to just look at what the average bill comprises and what’s driving it. So if we look – and this is three bars, two of them are household electricity costs and then the right one, just for the sake of comparison, is a typical small industrial user or an SME – small to medium enterprise. What we can see is that in respect of the delivered price to customers the network component is much, much greater. It’s now approximately 50 per cent compared to five years ago and the reason for that is well known and well documented and it’s all about whether we’ve got that balance right between the investment necessary to maintain a reliable supply, for which I’ve contended to you today that we shouldn’t underestimate that investment, but ultimately that’s a matter for the regulator, but it is driving the greater part of increases in cost to consumers.
The wholesale energy component, because it has remained basically constant over the 10 years, it continues to diminish as a part of the delivered cost of energy and all that those things would evidence to is that this is an efficient functioning market that needs no regulation and certainly any attempt by pricing authorities, as I said before, to try and mimic the market price is really fraught with risk. But, of course, the other mover is carbon charges which have moved or the whole raft of things we broadly call “green charges” which are now comprising about 15 per cent of a bill at a household level. Now, we’ve also put there a typical industrial user, because I think it’s very topical in the Australian economy because the percentages change quite substantially. In broad terms, industrial or SMEs, take their power at high voltages. They sort of use less network and therefore the distribution of their charges is quite different. So the wholesale – so the network component is less as a proportion for the reasons that I’ve just said and not surprising therefore the wholesale cost of energy is a bit more so they’re a bit more exposed to movements in the wholesale cost of energy but it is still a falling part of their bill compared to five years ago.
But in this case there’s various costs that we call the “green costs” – costs driven primarily by the RET scheme and the carbon price of 30 per cent of the delivered cost of energy for a small to medium enterprise. It transpires, in respect of our policy settings, that that part of the economy that is least able – and least able because it really doesn’t get any assistance – it doesn’t get adjustment through the tax system and you could say, in respect of a point that I made earlier, that the cost of carbon abatement is arguably infinite. You might say, “So what?” because households – and we do agree households have been compensated in gross dollar terms through the tax system for that cost and many industries have been compensated through the issuance of free permits for that cost, so for those organizations it actually doesn’t matter what the cost of carbon abatement is. But for small to medium enterprises and businesses that have got low levels of compensation or no compensation these are the ones that are bearing the burden of these policies and is smack in the heartland of Australian manufacturing and small commercial enterprises that that burden is being borne and I know many of those customers would say they are not able to pass those costs on in the way that is assumed.
So they are clearly becoming a very substantial driver of the delivered cost of energy for these customers, and no wonder that they are saying “This is hurting us”. So just to wrap up what might we say about these three objectives and whether or not they’re being met. Well, we would say in terms of the wholesale cost of energy that process which is the effective function of the NEM that delivers wholesale cost of energy is functioning effectively. It is delivering reliability at a competitive price. In fact, the same price last year as it was 10 years ago. In respect of our networks a very, very significant component of the delivered price of energy substantially increased over prior years, fundamentally a matter for the regulator who has the capacity to look and see what is driving those costs, but assuming we get that balance right those charges need to be what they are to make sure we’ve got reliable systems and I would say we’re in for another wave of increases in costs in the latter part of the decade as we contemplate the investment necessary to support an increasing amount of interruptible renewables in the system. So those costs will go up further.
I should say that even if we decide those costs are efficient or effective – whatever term we want to use – it is worth noting that Australia is a big country and our geography and climate means we move small amounts of power large distances in cities and rural areas with low population density. So all things being equal, even if we were at some efficient point I still think our network costs would be higher than international benchmarks. In respect of all of those policies that one might broadly call “green policies” at the end of the day they’re a matter of choice. These are all policies we’ve chosen to implement in Australia and they are having an impact and a substantial impact in some sectors, particularly SMEs and the cost of energy, and I think on the factual evidence we are entitled to ask whether we’ve got the right selection of policies and whether we are truly telling the community and our customers what the cost of these policies really are and how it’s affecting their energy bills.
In my view, unless we’re willing to do that in a very open way our customers are entitled to be concerned about the cost of energy and to doubt that they’re being best served by the current policy mix and I think it’s imperative that we take every opportunity to make sure that these costs are made transparent and consumers can be comfortable, can be confident, that the system that supplies them with energy is serving them well and producing a reliable competitively-priced supply of energy with lower carbon emissions. Thank you.