Wind and solar become new “base load” power for South Australia

It has only been a week since the closure of South Australia’s last coal-fired generator, but already a new pattern is emerging that points the way to a new energy system, away from “baseload” built around coal, gas or nuclear, to a new system built around wind and solar and other renewables.

wind solar baseloadThis graph – provided by Dylan McConnell from the Melbourne Energy Institute, shows he first week of production since the closure of the Northern brown coal generator on May 10.

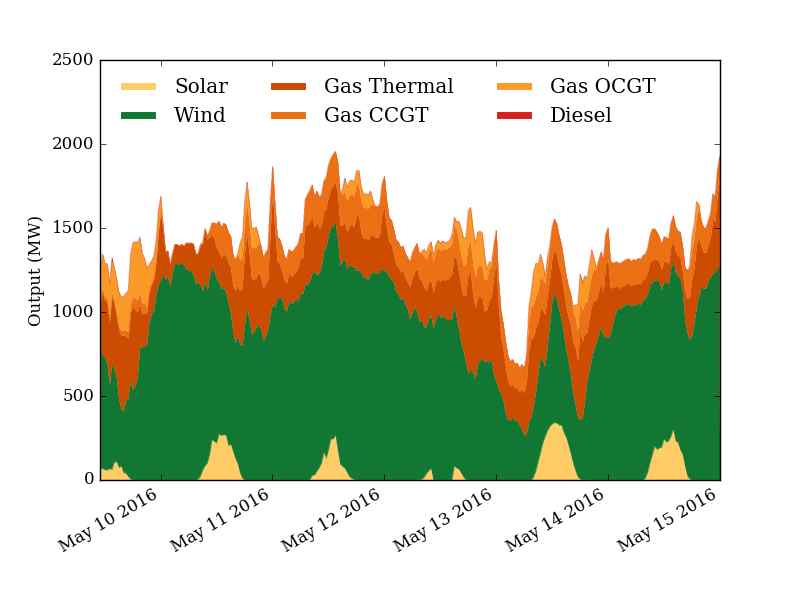
It shows wind energy provided the vast majority of power over the past seven days, supplemented by some rooftop solar, and by peaking and combined cycle gas plants.

This is expected to be the pattern of the future, as energy systems with high renewable energy penetration rely first on variable energy providers such as wind and solar, and then on “flexible” or “dispatchable” energy from the likes of gas, but ultimately hydro, solar towers with storage, and emerging technologies such as geothermal and ocean energy and battery and other energy storage.

Some days – at least in South Australia there will be likely be a lot more solar in the daytime, quite likely up to 100 per cent of daytime demand on occasions. And there will be times when there is a lot less wind. On some days there will be little wind or solar, so the South Australia grid will have to rely on more gas (expensive) or more brown coal from Victoria (dirty and not so cheap) through the inter-connectors.

south australia since interconnect

But in the first seven days, as this graph above shows, the amount of imports and exports has been reasonably evenly balanced since the coal-fired generator was switched off. (White above the line signals imports, green below the line signals exports).

sa before and after

And as this next graph (above) shows, there is not a lot of difference between the level of imports and exports before Northern was switched off, and in the first week afterwards.

More importantly, there have been no blackouts (apart from some minor ones caused by some ferocious storms) and South Australia’s wholesale prices have been comparable (on some days slightly more expensive, on others slightly cheaper) than its mainland counterparts.

In addition, in the first week, the state has probably reduced emissions from its energy system by around 15 per cent, as output from Northern is largely replaced by output from gas fired generators, according to estimates from Mike Sandiford, also from the MEI.

Northern had emissions of 1.1 tonnes of Co2/MWh, while Osborne is rated around 0.64t/MWh (although some gas generators in South Australia, such as Hallett, have emissions of more than 1t/MWh).

McConnell and Sandiford stress that it is early days yet, just one week, but a pattern is emerging. As the penetration from wind energy and rooftop solar continues to grow – their combined share is expected to reach 50 per cent of annual demand later this year – then more dispatchable options will be looked at.

The local grid operator is already looking at options such as large-scale battery storage on its networks, and creating micro-grids along its lengthy and thin network.

Some energy advocate suggest pumped hydro, and there is a major push for solar tower and storage in Port Augusta, to partially replace the coal generators, that could provide power on demand, as well as ancillary services as frequency control for the grid.

Despite predictions of economic doom and unreliable power, the Australia Energy Market Operator has said that the exit of coal will not make the local network more unstable or more unreliable, although it will rely on the two inter-connectors to Victoria.

Last week, renewable energy accounted for more than 95 per cent of demand for a few hours on a Sunday in Germany, the world’s fourth largest economy, but it did not cause any grid issues. Germany, despite its high renewables penetration (actually less than South Australia), has one of the most stable grids in the world.

For more information on the “new base-load” and how renewables will replace the old “base load and peak load” power systems, read this and/or this. Or for the UK, read what the head of the National Grid said about the outdated concept of base load power.

h australia may 16Note: As South Australia’s wind contribution continued to surge in South Australia on Monday afternoon, providing more than 1,200MW of supply – or virtually all of the state’s demand at the time – prices fell to the lowest levels on the main grid, around $16/MWh.

See more live data on our website here.

In Tasmania, however, the need to switch on gas fired generation again after five days of 100 per cent renewable energy sent prices trebling to more than $120/MWh, according to the AEMO price data.

Comments

16 responses to “Wind and solar become new “base load” power for South Australia”

  1. Henry WA Avatar
    Henry WA

    I assume that output matches demand and that the very sharp peaks and troughs are caused by demand changes. Over a 24 hour period they are much steeper and more defined than I had expected. This confirms the author’s contention that forecastable wind and solar are performing the base load function (to extent that base load function is relevant at all). Dispatchable output, including exports/imports and demand management, is obviously important. It is noticeable that there is very sharp peak in demand at midnight each day, which surely could and should be removed by better demand management

    1. Cooma Doug Avatar
      Cooma Doug

      There is a hot water peak of significance around these times.
      The old load side idea. This will be a non event when they get their act together. Load side management in the home can achieve a much better result and with zero impact on the grid profile.

  2. Alan S Avatar
    Alan S

    Ever since moving to SA I’ve wondered why the gas thermal generation at Torrens Island wasn’t replaced by a more efficient closed cycle gas turbine system as at Pelican Point. Does anyone know if it was considered? It’s probably not attractive due to initial cost and the fact that most politicians are technically-challenged.
    As an aside, an article in the ATA’s current Renew magazine states that Loy Yang A can halve its output in less than an hour, I’m not disputing this but it challenges the conventional wisdom that coal stations have the response of the Queen Mary to change. The speed of response by different generation methods – fossil, nuclear and renewable might make an interesting article in Renew Economy.

    1. David Osmond Avatar
      David Osmond

      Hi Alan, you can watch each power station ramp its output up and down during a day on this site (untick all power stations except the ones you’re interested in, it’s fastest to untick using the state boxes):
      http://energy.anero.id.au/fossil-energy/2016/may/15

      or look at an entire month here:
      http://energy.anero.id.au/fossil-energy/2016/may

      1. Alan S Avatar
        Alan S

        Thanks. BTW I recently asked Renew Economy about interconnector transmission and was told that http://www.NEM-Watch.info shows these.

  3. Cooma Doug Avatar
    Cooma Doug

    The graphs presented with the peaking plant at the top are a good indication of what happens. It also shows clearly that large base load, be it fossil nuclear or what ever is not the solution to any of the issues. It is the cause of the problem. By this I mean the 100 plus year model has brought us here and blinded us a to the cheaper obvious solutions.

    The peaking generation on these graps will disappear into the renewable outputs and the adoption of emerging technologies. This will happen via load side milli second response to demand and system stability issues.
    If you eliminate the generation depicted in the red and brown and replace it as described, the plant performing the peaking tasks will do so at several times the capacity factor. This simply means several times cheaper. The graph of 2040 will be flat all day and green.

  4. Alexander Marks Avatar
    Alexander Marks

    Giles – a few unit errors in this sentence:

    “Northern had emissions of 1.1kg/kWh, while Osborne is rated around 0.64g/kWh (although some gas generators in South Australia, such as Hallett, have emissions of more than 1kW/kWh).”.
    I think you mean g/kWh for all of the above.

    1. Phil Shield Avatar
      Phil Shield

      Should be kg/kWh or tonnes/MWh (which is the same thing) for all of these. Looks like it has now been corrected.

  5. Les Johnston Avatar
    Les Johnston

    The fossil myth is being exposed as fraudulent now that SA has cut off its coal power generation. Drawing the graphs of energy delivered with solar and wind in the base of the graph does wonders for redefining base load.

  6. Alex E Avatar
    Alex E

    A detail that is looked over is that “imports” means, more than likely, its Hazelwood burning the coal for us. It’s great that renewables has gotten us to where we are today but lets not muddy the facts to spruik a feel-good headline. Theres still more work to be done, and it needs to be done over the border.

    1. Malcolm M Avatar
      Malcolm M

      Hazelwood was certainly NOT producing extra for SA during these periods. Its power production was flat. To avoid the appearance of supporting the fossil fuel industry, it is worthwhile doing some basic fact checking on the website of Aneroid Energy (http://energy.anero.id.au/). This has clickable graphs for all large power stations on the NEM.

      On the 9th and 13 of May there were high imports of power into SA, of about 500 MW (see graph above). The brown coal stations tend to operate at high capacity factors 24/7, so we would expect that the extra demand from SA would be met by Victorian gas and hydro stations. However, in the graphs on the Aneroid Energy website there is no evidence of an extra 500 MW of additional production on these dates. I’m not sure where it came from, but it didn’t seem to present a problem to the Victorian grid.

  7. Ian Avatar
    Ian

    Interesting that there never is a time that wind produces no electricity, the gas plants appear to run constantly at a constant rate, solar appears to have very little contribution. The principle of renewables generation is to have excess capacity to cover the times when the resource is poor to reduce the need for expensive storage or interconnections. These graphs tell me that more wind and solar generation is needed to improve reliability of the grid in South Australia.

  8. Peter Avatar
    Peter

    Despite all the excitement above, seems to me South Australia has just switched from SA coal and jobs to Vic coal and jobs. The wind has been blowing strongly for a week, but remember that Australian Wind turbine efficiency was 29% last year so when the wind don’t blow, Vic coal will be powering the state. Without the interconnectors, SA is cactus and large scale storage (GWh) still a pipedream.

    1. dhm60 Avatar
      dhm60

      Ah, but there are interconnectors and there will be even more in the future (and large scale storage). That will allow SA to make lots of money selling electricity to the eastern states to cover their summer and wnter air-conditioner surges. When the coal burning dinosaurs in NSW and Vic are forced to close or ??refit; they will make even more.
      btw Portugal, Scotland, Denmark and northern Germany have been doing the same thing for years. Tasmania, on the other hand, is a good example of an opportunity lost.

  9. newnodm Avatar
    newnodm

    Solar would not show self-consumption, correct?

  10. Nick Abbott Avatar
    Nick Abbott

    This has serious issue!
    (1) South Australia recently had a massive electricity shortage due to severe lack of baseload power, forcing factories to close *
    (2) South Australia has the 3rd most expensive electricity prices in the world.**

    * http://www.abc.net.au/news/2016-07-14/electricity-price-fluctuations-hit-sa-business/7627742
    * http://www.adelaidenow.com.au/business/baseload-power-instability-why-bhps-sa-power-bill-hit-25m–in-a-day/news-story/8128f3511f701ff233f83b1b4e4ac94e
    ** http://www.adelaidenow.com.au/news/south-australia/power-prices-to-be-highest-in-the-world/story-e6frea83-1226305741810

Get up to 3 quotes from pre-vetted solar (and battery) installers.