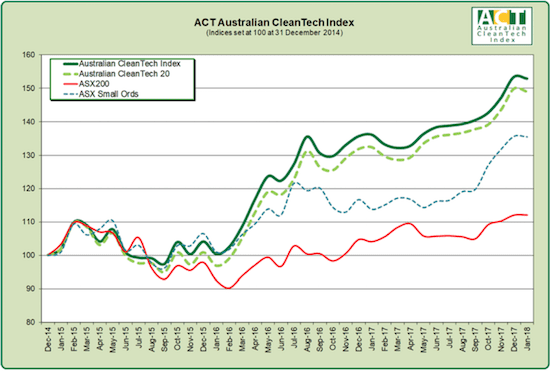
The Australian CleanTech Index fell from 65.71 to 65.48 over the month of January recording a 0.3% loss. This compared to the ASX200 gain of 0.03% and the ASX Small Ordinaries Index loss of 0.1%. The Australian CleanTech 20 fell by 0.6% for the month.
The CleanTech Index continues to outperform the wider market over all the other reported periods with the three-year performance leading the ASX200 by 40%.
The best performing sub-index for the month was the Australian Water Index with a 1.9% gain, led by a 9.5% gain from Reliance Worldwide Corp.
The worst performing sub-index was the Australian Efficiency, Storage & Sustainable Minerals Index that recorded a 2.9% loss for the month led by falls from Syrah Resources and Galaxy Resources.
|
Percentage Change |
FY14 |
FY15 |
FY16 |
FY17 |
JAN 18 |
3 Mnths |
6 Mnths |
12 Mnths |
3 Years |
|
ACT Australian CleanTech Index |
19.6% |
16.6% |
21.3% |
13.1% |
-0.34% |
7.1% |
10.1% |
12.3% |
50.0% |
|
Australian CleanTech 20 |
19.6% |
16.0% |
18.4% |
14.8% |
-0.58% |
7.1% |
9.5% |
12.5% |
46.2% |
|
ASX200 |
12.3% |
1.3% |
-4.3% |
9.4% |
0.03% |
2.7% |
5.9% |
7.8% |
8.6% |
|
ASX Small Ords |
9.6% |
-2.8% |
10.4% |
3.6% |
-0.13% |
6.7% |
16.3% |
19.0% |
34.2% |
The market capitalisation of the 82 stocks in the Australian CleanTech Index now sits at A$40.8 billion.
The month’s performance included 14 companies with gains of more than 20%. The greatest percentage gains were recorded by Australian Vanadium (AVL), Quantum Energy (QTM) and Battery Minerals (BAT). The greatest market capitalisation gain was recorded by Reliance Worldwide Corp (RWC).
These gains were partially offset by 7 companies recording losses of more than 15% led by BuildingIQ (BIQ), Papyrus Australia (PPY) and Kalina Power (KPO). The greatest market capitalisation loss was recorded by Galaxy Resources (GXY).
These best and worst performers are shown in the table below.
|
January 2018 |
|
|
Best Performers Share Price Gain > 20% |
Worst Performers Share Price Loss >15% |
|
Quantum Energy SECOS Group Protean Wave Energy Vivid Technology HRL Holdings |
Leaf Energy |
The chart below has been recast from previous reports with the four indices all set to 100 at 31 December 2014.

The Australian CleanTech Index is published each month on the Australian CleanTech website at www.auscleantech.com.au and various high quality domestic and international publications.
Monthly performance reports can be emailed directly by signing up to the distribution list at www.auscleantech.com.au/pages/ACT_Australian_Cleantech_Index.php.
John O’Brien is managing director of the Australian CleanTech Index