Consumption of electricity within the National Electricity Market (NEM) states (excluding Western Australia and the Northern Territory) has fallen for the 5th consecutive calendar year. Electricity consumed within in the NEM in 2013 was 2.8 per cent lower than the electricity consumed within the NEM in 2012.
This Research Note analyses the changes in electricity generation and consumption in the NEM for the year ending 31 December 2013 and compares it to the same period in 2012.
Our analysis is based on scheduled demand and generation data published by the Australian Energy Market Operator (AEMO) and provided through NEM-Review. The data does not directly measure actual consumption as it includes transmission losses, power station auxiliary use (power used in the power station) and excludes non-scheduled generation. As transmission losses, auxiliary use and non-scheduled generation have been fairly stable over the last three years it provides a solid basis for analysing year on year changes to electricity consumption.
Electricity consumption fell in all states with the exception of Tasmania (2.5 per cent growth). In relative terms the most significant drop in consumption was observed in South Australia (3.7 per cent), which was closely followed by New South Wales (3.6 per cent). Queensland and Victoria decreased by 2.4 and 2.8 per cent respectively.
As 2012 was a leap year (with 366 days), 536 gigawatt hours (GWh) of the reduction (0.3 per cent) can be explained by 2013 having one less day than 2012. Once we allow for the impact of the leap year, underlying electricity consumption in the NEM reduced by 2.5 per cent. There are a range of reasons that can explain the reduction including; decline in level of manufacturing, milder weather, installation of residential solar, and improved energy efficiency, amongst others.
An average of approximately 850 MW per annum of solar PV has been installed in NEM states over the last two years which accounts for 22 per cent of the reduction in consumption. Solar hot water systems and energy efficient activities supported by market based measures accounted for another 19 per cent of the lower consumption.
Scheduled renewable generation increased by 22 per cent in 2013 and accounted for 11.9 per cent market share (9.5 per cent in 2012). This increase was at the expense of gas and coal-fired generation. The largest relative decrease was observed in gas where generation fell 7.7 per cent or 1.9 TWh. Generation from coal-fired plant accounted for the largest drop in generation in absolute terms (7.7 TWh), dropping by 5 per cent from 2012 levels. Generation from coal fell in all states, except New South Wales. Queensland experienced the largest reduction in coal-fired generation falling by 10.6 per cent largely due to the closure of a number of coal-fired units.
Scheduled renewables (excludes smaller non-scheduled small wind, bioenergy, and solar) experienced significant growth in 2013. Due to a wet 2013 hydro was able to generate at record levels with generation growing 17.7 per cent or 2.7 TWh (largely as a result of hydro plant in Tasmania). Generation from wind grew 43.1 per cent or 1.4 TWh (957 GWh of which came from Victoria’s Macarthur wind farm).
2. NEM electricity consumption
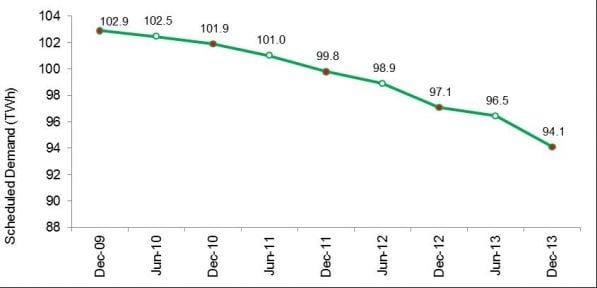
Electricity consumption (as measured by scheduled demand) has continued the decline that started back in 2009 (refer to Figure 1) and fell by 5,448 GWh for the 12 months ending 31 December 2013. All states other than Tasmania experienced a reduction in electricity consumption with South Australia and NSW experiencing the largest reductions with 3.7 per cent and 3.6 per cent respectively (Figure 2).
NSW experienced the largest absolute reduction (2,579 GWh), a significant portion of which was attributable to the closure of the Kurri Kurri aluminium smelter towards the end of 2012.
Approximately 0.3 per cent of the reduction (536 GWh) can be explained by 2012 being a leap year and having an extra day. For a “like with like” comparison we have adjusted for the impact of the leap year by adjusting 2012 consumption downwards by 536 GWh. This was equal to one day of the 2012 average daily demand. Electricity consumption for an adjusted 2012 was 195.5 TWh, this fell by 4.9 TWh in 2013 (2.5 per cent). Refer to Table 1 for electricity consumption figures by state including the impact of the leap year adjustment.


Table 1 – Scheduled electricity demand by state – GWh (2013 cf: 2012)
More than 850 MW a year of roof-top solar PV was installed in NEM states over the 2012 and 2013 period and is estimated to have generated an additional 1,182 GWh for 2013. This would account for 22 per cent of the reduction in overall consumption. The contribution of solar hot water and an array of energy efficiency activities supported by the NSW and Victorian Energy Savings Schemes have also contributed to lower electricity consumption. These activities, supported through government legislated market-based schemes, is estimated to account for a further 1,042 GWh of the overall reduction in consumption. In total, identifiable distributed energy activities could reasonably account for more than 2,200 GWh of demand reduction equivalent to 41 per cent (refer to Figure 3).

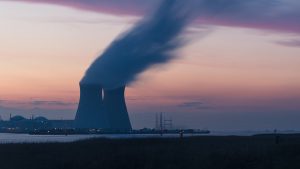
3. Power generation in the NEM
Coal-fired generation, as a proportion of total NEM-wide generation, has fallen from 78 per cent in 2012 to 76.2 per cent in 2013 (refer to Table 3). Gas fired generation has also reduced its market share falling from 12.5 per cent of NEM generation in 2012 to 11.8 per cent in 2013. Scheduled renewables have increased their market share from 9.5 per cent in 2012 to 11.9 per cent in 2013.
Coal generation fell 5.0 per cent from 2012 levels and gas generation fell by 7.7 per cent, bearing the brunt of the reduction in electricity consumption (refer to Figure 4 and Table 2). Scheduled-wind generation increased by 43 per cent in 2013 largely due to a full year’s output from the 420 MW Macarthur wind farm in Victoria and the commissioning of the Mt Mercer Wind Farm (Victoria) and the Musselroe Wind Farm (Tasmania) in 2013. Hydro generation also increased significantly during the year (17.7 per cent) due to continuing wet conditions and the drawdown from storages, particularly in Tasmania.


Electricity generated by fuel source and by state is included as Table 3. Some key observations on changes in generation mix on a state by state basis are as follows:
• NSW – NSW was the only state where coal-fired generation actually increased during the year, rising by 1.2 per cent. Gas and renewables generation also increased, each rising by approximately 6 per cent.
• QLD – Power generation in Queensland declined by 9.6 per cent (5,472 GWh). Generation from coal-fired plant reduced by 10.6 per cent (4,836 GWh) and generation from gas reduced by 7.2 per cent (745 GWh)
• SA – South Australia experienced the most marked decline in scheduled generation, falling by 14.2 per cent. Coal-fired generation fell by 31.7 per cent and gas-fired generation fell 13.5 per cent.
• TAS – Along with NSW, Tasmania was the only other state to have increased its scheduled generation, rising 18 per cent (1,918 GWh). Hydro generation increased by 25 per cent due to continued wet conditions and running down water storage levels. Storage levels across the Tasmanian hydro system fell from 55 per cent at the start to 2013 to 47 per cent by the end of 2013. The first scheduled wind farm in Tasmania started generating in May 2013, having no scheduled wind generation previously, the full complement of Mussleroe’s 301 GWh 2013 generation represented an increase on 2012 levels. Offsetting the increase in renewable generation was a 40 per cent reduction in gas-fired generation from the Tamar Valley gas generator (647 GWh).
• VIC — Victoria’s generation fell by 2.8 per cent (1,393 GWh) in 2013. Coal-fired generation dropped by 5.5 per cent (2,631 GWh) and was partially offset by a rise in Wind generation of 976 GWh. The Macarthur wind farm had its first full year of generation in 2013 and generated an extra 957 GWh compared to 2012 (Macarthur generated for the first time in September 2012). In addition the Mt. Mercer wind farm started generating in November 2013.

Notes:
• Data has been sourced from AEMO (NEM-Review) and reflects scheduled generation, including power station auxiliaries and losses. The table below includes the state average for these factors over the three years to 2011/12.
• The AEMO data includes only scheduled generation. As a result non-scheduled renewables is excluded and we estimate that this amounts to at least 6,700 GWh (3.5 per cent of total generation).
• Solar PV is not included as a generation source and is included as lower electricity consumption
Ric Brazzale is head of Green Energy Markets.